
Advertisement
Advertisement
30-Yr U.S. Treasury Bonds (US) Futures Technical Analysis – August 24, 2015 Forecast
By:
September 30-Year U.S. Treasury Bonds are trading relatively flat shortly before the cash market opening. Traders will be taking their cues from the stock
September 30-Year U.S. Treasury Bonds are trading relatively flat shortly before the cash market opening. Traders will be taking their cues from the stock market today once again. A heavy sell-off in the equity markets is likely to drive T-Bonds sharply higher. If there is a “dead cat bounce” in the stock market, following an early sell-off then look for T-Bonds to sell-off.
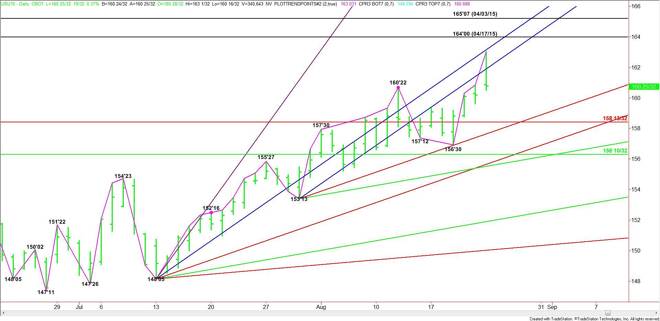
The first upside targets are a pair of steep uptrending angles at 161’29 and 163’05. A sustained move over these angles will put the market in an extremely strong position with potential targets the April 17 top at 164’00 and the April 3 top at 165’07.
A failure to hold above the angle at 161’29 will signal the presence of sellers. The daily chart indicates that this is a potential trigger point for a steep sell-off since the next major downside target is the major Fibonacci level at 158’13.
Watch the price action and read the order flow at 161’29 today. This will tell us whether the bulls or the bears are in control. Read the price action in the stock market too. If buyers come in to support the market after an extreme sell-off then look for T-Bonds to top out.
About the Author
James Hyerczykauthor
James Hyerczyk is a U.S. based seasoned technical analyst and educator with over 40 years of experience in market analysis and trading, specializing in chart patterns and price movement. He is the author of two books on technical analysis and has a background in both futures and stock markets.


Advertisement