


AMZN Technical Analysis
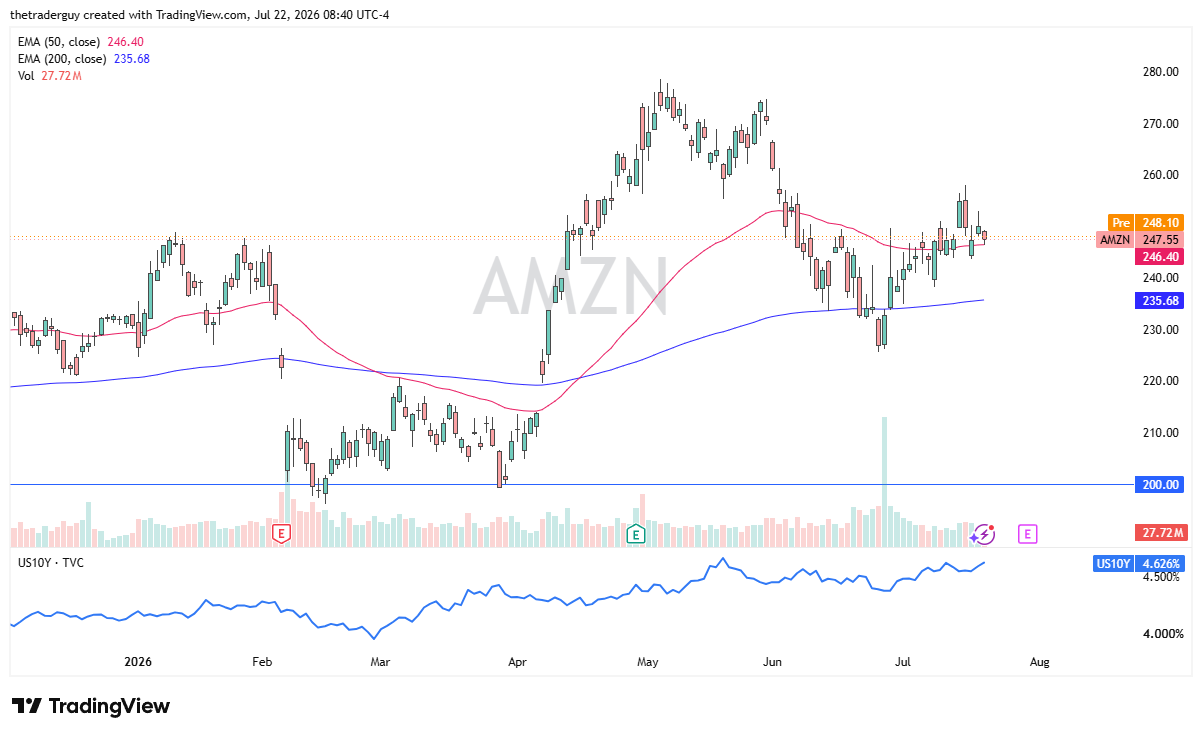
The pre-market trading for Amazon is slightly positive. It is a market that has recently broken out of a V-shaped consolidation pattern. It’s dropped to test the 50-day EMA and now looks as if it is trying to at least bounce from there. It’ll be interesting to see how this plays out, but if it follows the trajectory that it was on just last week, it could see a move towards $260. Amazon has seen a significant turnaround. It does have an earnings call on the 30th, so between now and then, it could be a little cautious.
WMT Technical Analysis
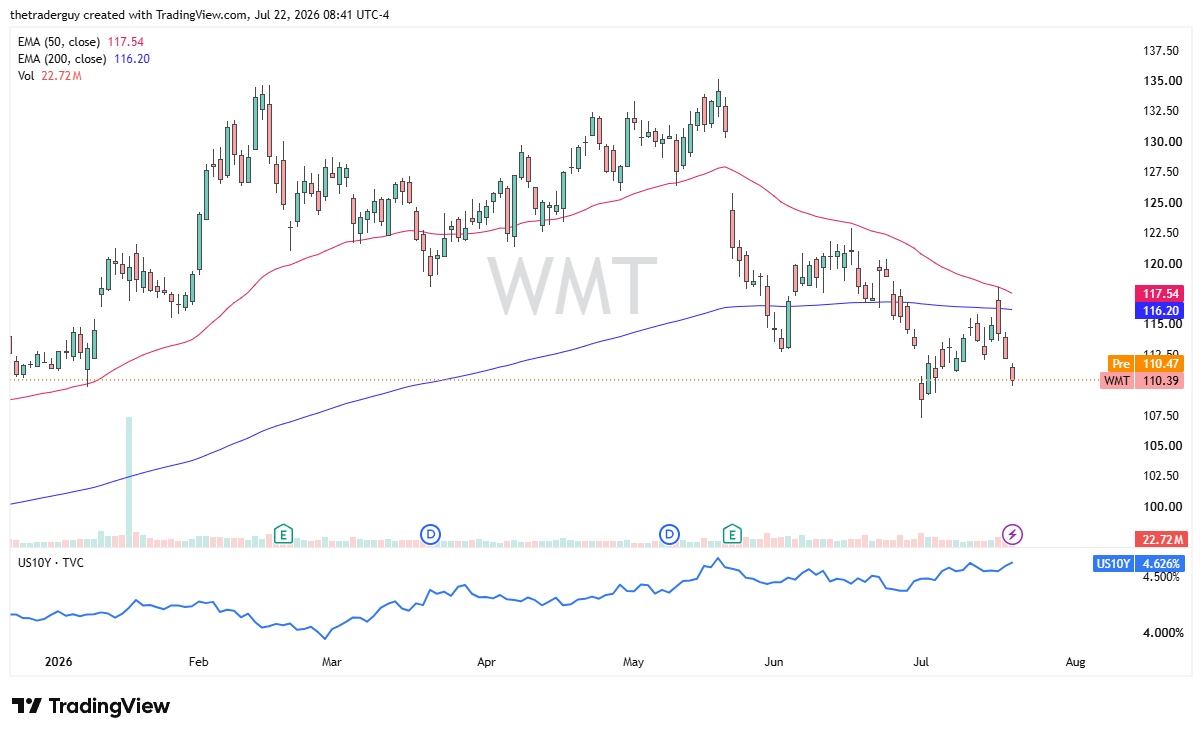
Walmart, on the other hand, looks pretty flat at the open. Walmart certainly seems as if it is in a bit of a significant drop. It had broken down during the last earnings call on bad guidance. We dropped, we bounced, tested the 50-day EMA, fell again, tested the 50-day EMA for a second time, and then fell. That’s where we find ourselves right now, simply plunging.
The $100 level has a lot of psychology attached to it. I’ll be watching for a potential setup, not really interested in getting involved quite yet, though.
TGT Technical Analysis
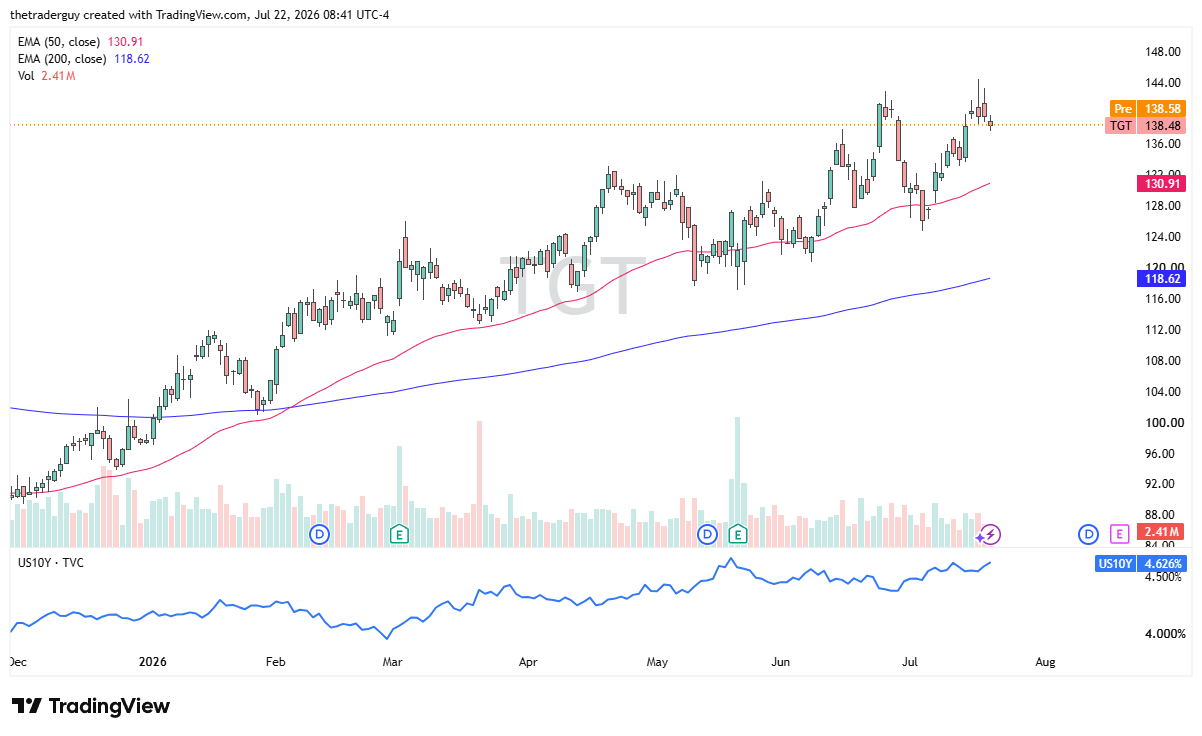
Target looks like it’s going to be ever so slightly positive based on pre-market trading. It recently has formed a double top right here around $143, so breaking above there could open up a bigger move. We’ll just have to wait and see. The 50-day EMA does seem to support this market fairly well, as a trendline going back to basically Christmas of last year. So we’ll see if it falls, if that ends up being an area to be a buyer of. Keep in mind interest rates continue to rise, and that could be weighing on the idea of consumer spending, so it could be a sector issue eventually.
If you’d like to know more about technical analysis and how traders use it, please visit our educational area.