


Record High Breakout Defies Sector Weakness
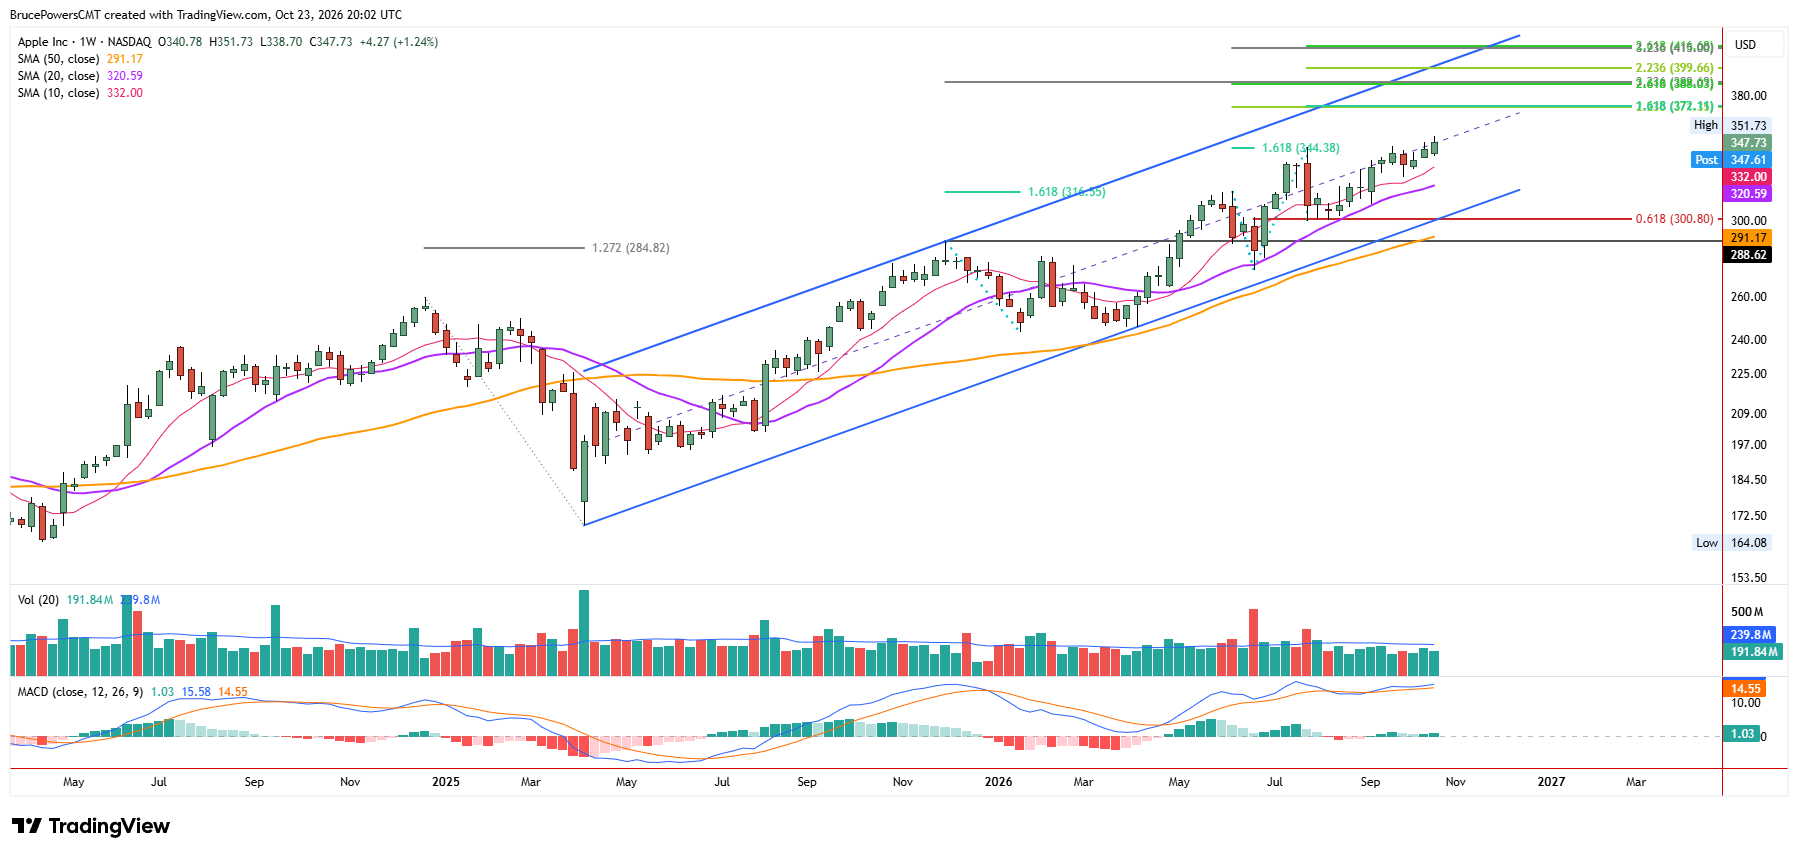
While the larger technology sector is under pressure, Apple Inc. (AAPL) confirmed a base breakout and trend continuation signal by reaching a new record high of $351.73 this week. A new record weekly close of $347.73 confirmed the signal, following an initial breakout signal last week that failed to confirm. This relative strength reinforces AAPL’s market leadership, even as technology stocks in general face pressure. Be aware that the company reports Q4 2026 earnings on November 2, after the market close, which could increase volatility around the breakout.
$338.70 Support Holds Key to Bullish Structure
Key support is this week’s higher low of $338.70, as a decline below that level would signal a weekly reversal in the three-week advance and raise the risk of a test of lower support levels. A decline below this week’s low would also signal a potential breakout failure, increasing the risk of further downside. If buyers cannot sustain support above that low, the bullish case would weaken, potentially reducing technical buying interest. The 10-week moving average, currently near $332, is a near-term dynamic support level that can be watched. It was tested as support during the recent pullback, which established an interim higher swing low and key support from structure at $325.81.
Weekly Close Signals Need for Confirmation
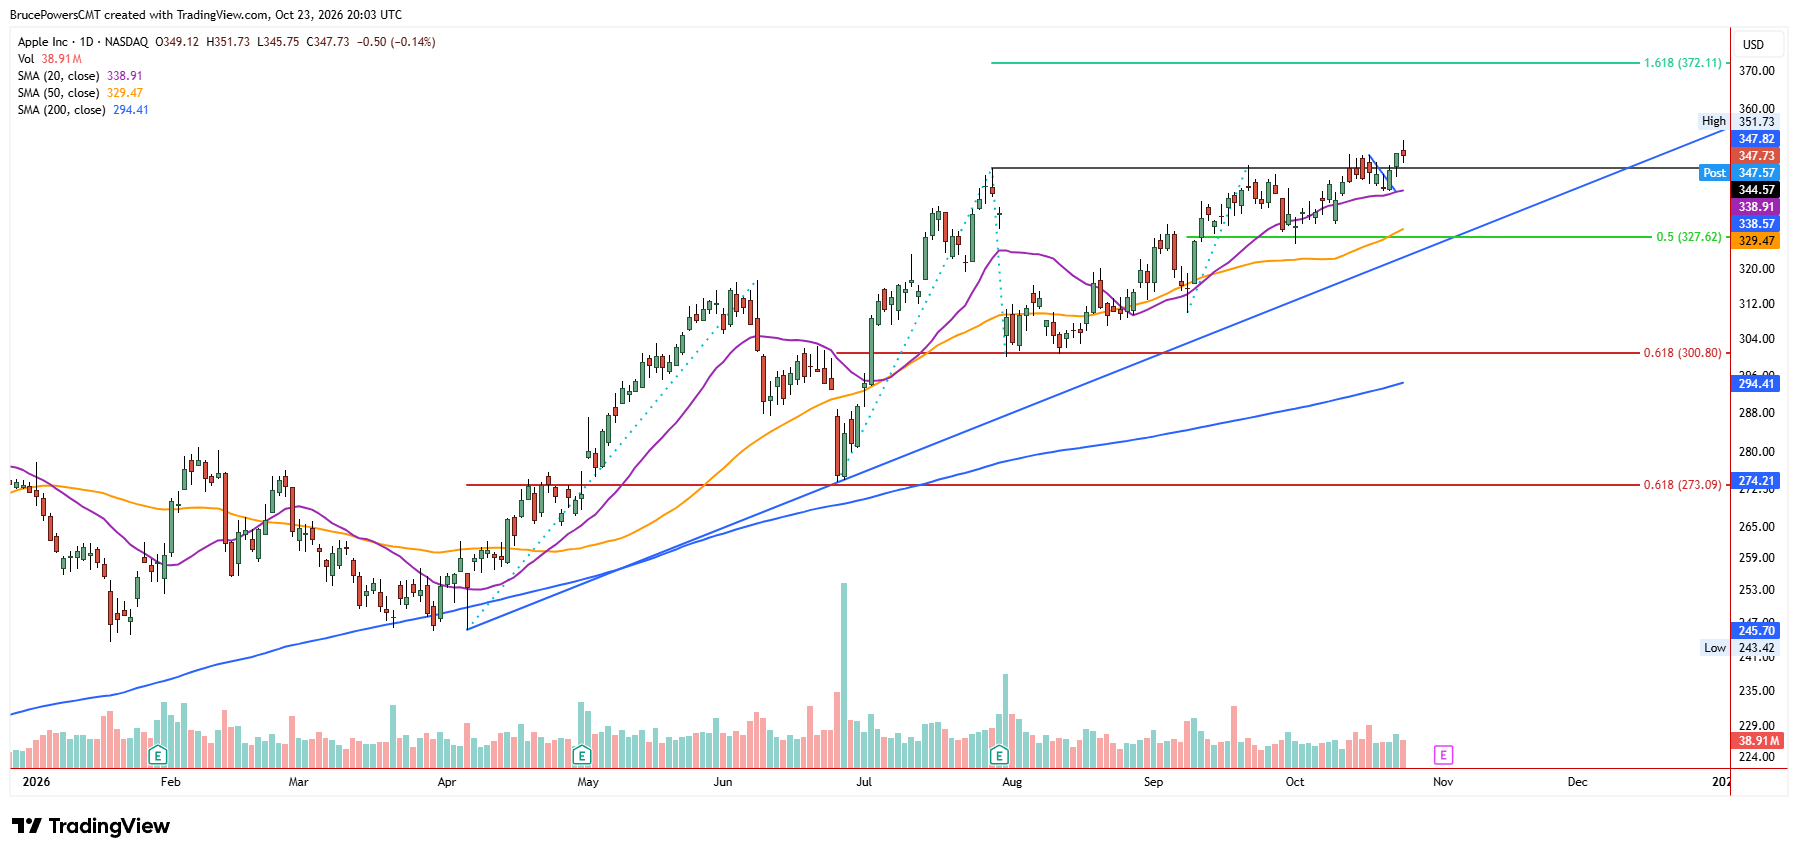
Although the bulls are in control, as indicated by the record weekly close, the finish was not as it could have been following the breakout. The close remained below the upper third of the week’s range despite the new high. This highlights the need for additional bullish confirmation signals. It also suggests that AAPL remains at risk of a pullback below the $344.57 breakout level from the July high.
Fibonacci Confluence Points Toward $372
The weekly chart also identifies potential upside targets through a confluence of Fibonacci extensions drawn from three prior downswings. Following the two most recent breakout to new highs, AAPL found resistance near the 161.8% Fibonacci extension of the prior decline. An earlier breakout encountered resistance near the 127.2% Fibonacci extension level.
Therefore, the 161.8% Fibonacci extension level of the recent decline near $372 becomes a potential upside target, reinforced by the 223.6% extension of a previous decline near $371. A sustained move higher would strengthen the bullish continuation case, while a break below $338.70 would put the recent advance at risk and shift attention toward lower support.
If you’d like to know more about technical analysis and how traders use it, please visit our educational area.