


Dramatic Reversal Sparks New Record High
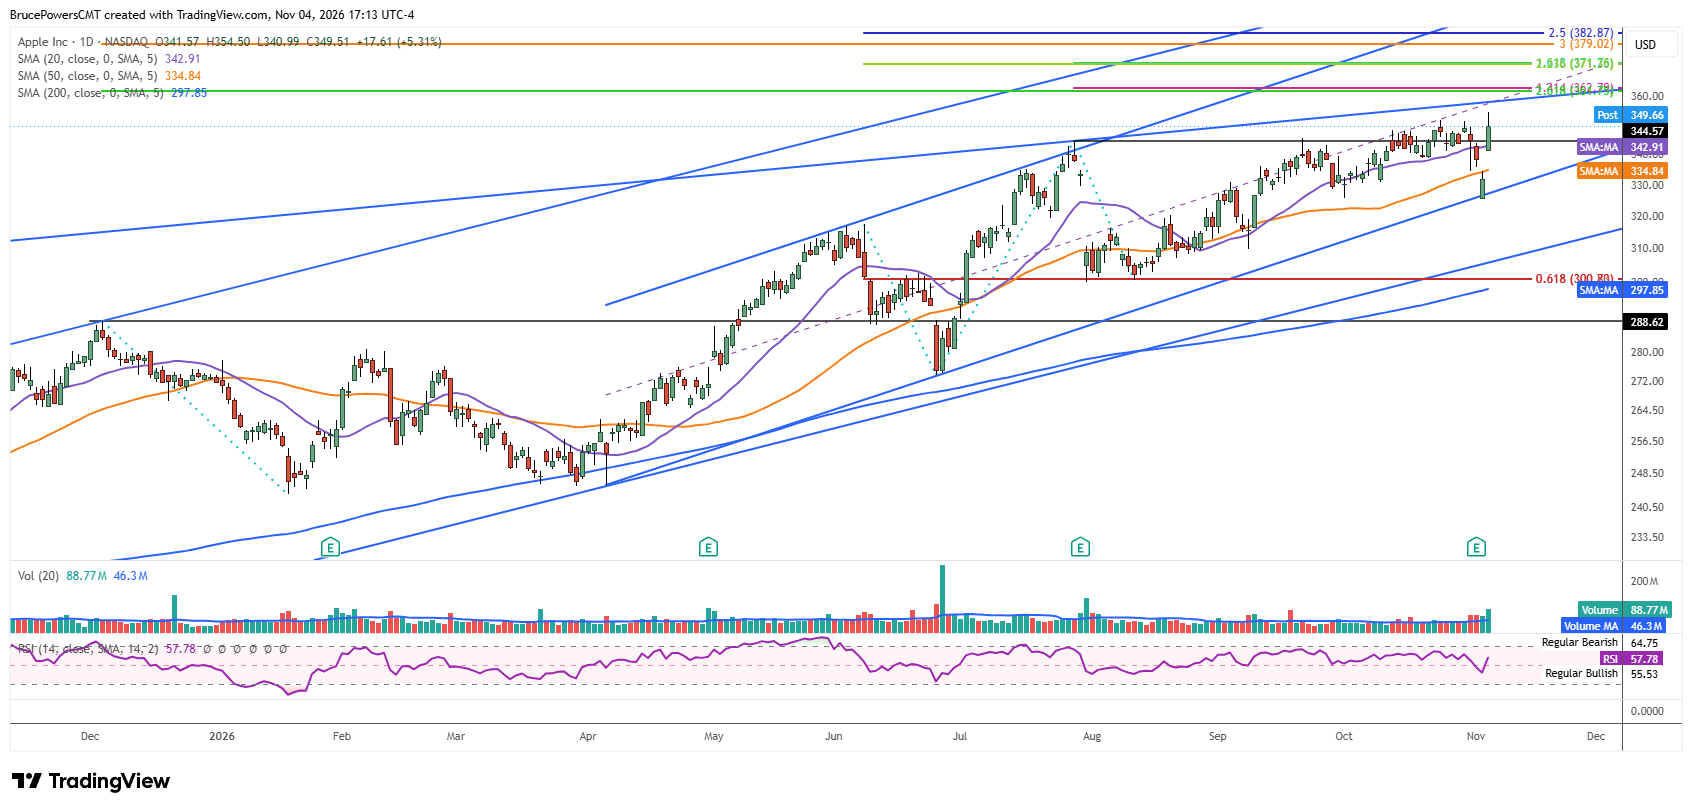
Apple Inc. (AAPL) retained a leadership position on Wednesday, as it broke out of a 14-week consolidation base to a new record high of $354.50. That new high, however, was unexpected given the sharp decline below prior support at $325.81 on Tuesday that followed the release of its Q4 2026 results after the market close on Monday’. A 13-week low of $325.33 was reached, with support found near a rising trendline that is inside a larger trend channel. Further, that low was near support indicated by the 20-week moving average on the weekly chart. That indicator is important, since it was confirmed as support several times since it was reclaimed in mid April.
Short Covering Adds Fuel to Bullish Momentum
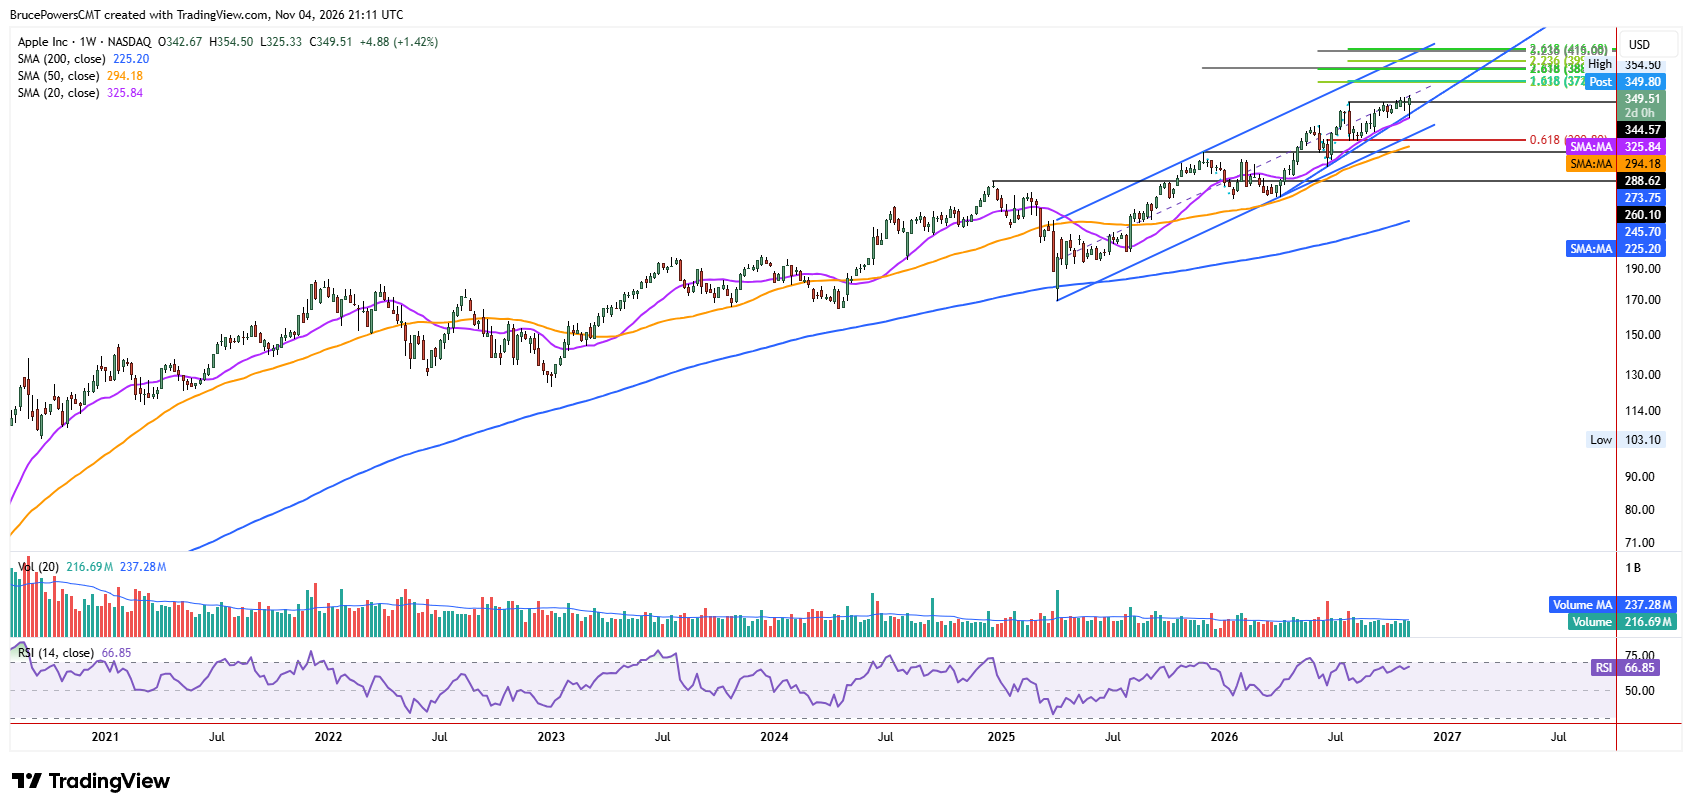
Some investors were likely taken out of the stock on Tuesday and got back I on Wednesday. Also, there was probably some short covering helping bullish momentum as well. Nonetheless, the long-term bullish trend continuation signal above the three-week high of $351.73, will confirm on a weekly basis if this week closes above that level.
Breakout Follow-Through Finally Gains Traction
An initial base breakout triggered on October 13, but demand did not improve enough for the trend to continue much higher. Bullish follow-through had been muted, suggesting that weakness may occur before the trend extension continues in a sustainable fashion. Now that stronger demand has emerged, the recent price action could help attract additional buyers.
Pullback Risk Meets Longer-Term Bullish Potential
Despite the new high breakout, AAPL remains at risk of another pullback in the short-term since bullish momentum that led to the breakout began from Tuesday’s low, suggesting that the move may soon get extended. Nonetheless, the bullish implications of this week’s price action remain, and traders will be watching for a pullback and consolidation to find new opportunities in the stock.
Other than the rising trendline tested on Tuesday, potential support is at the confluence of last week’s low of $334.35 and the 50-day moving average near $335. A sustained decline below last week’s low of $334.35, particularly on a closing basis, may put the new bullish breakout signal into the failed breakout category.
If you’d like to know more about technical analysis and how traders use it, please visit our educational area.