


Earnings Ignite Renewed Buying Interest
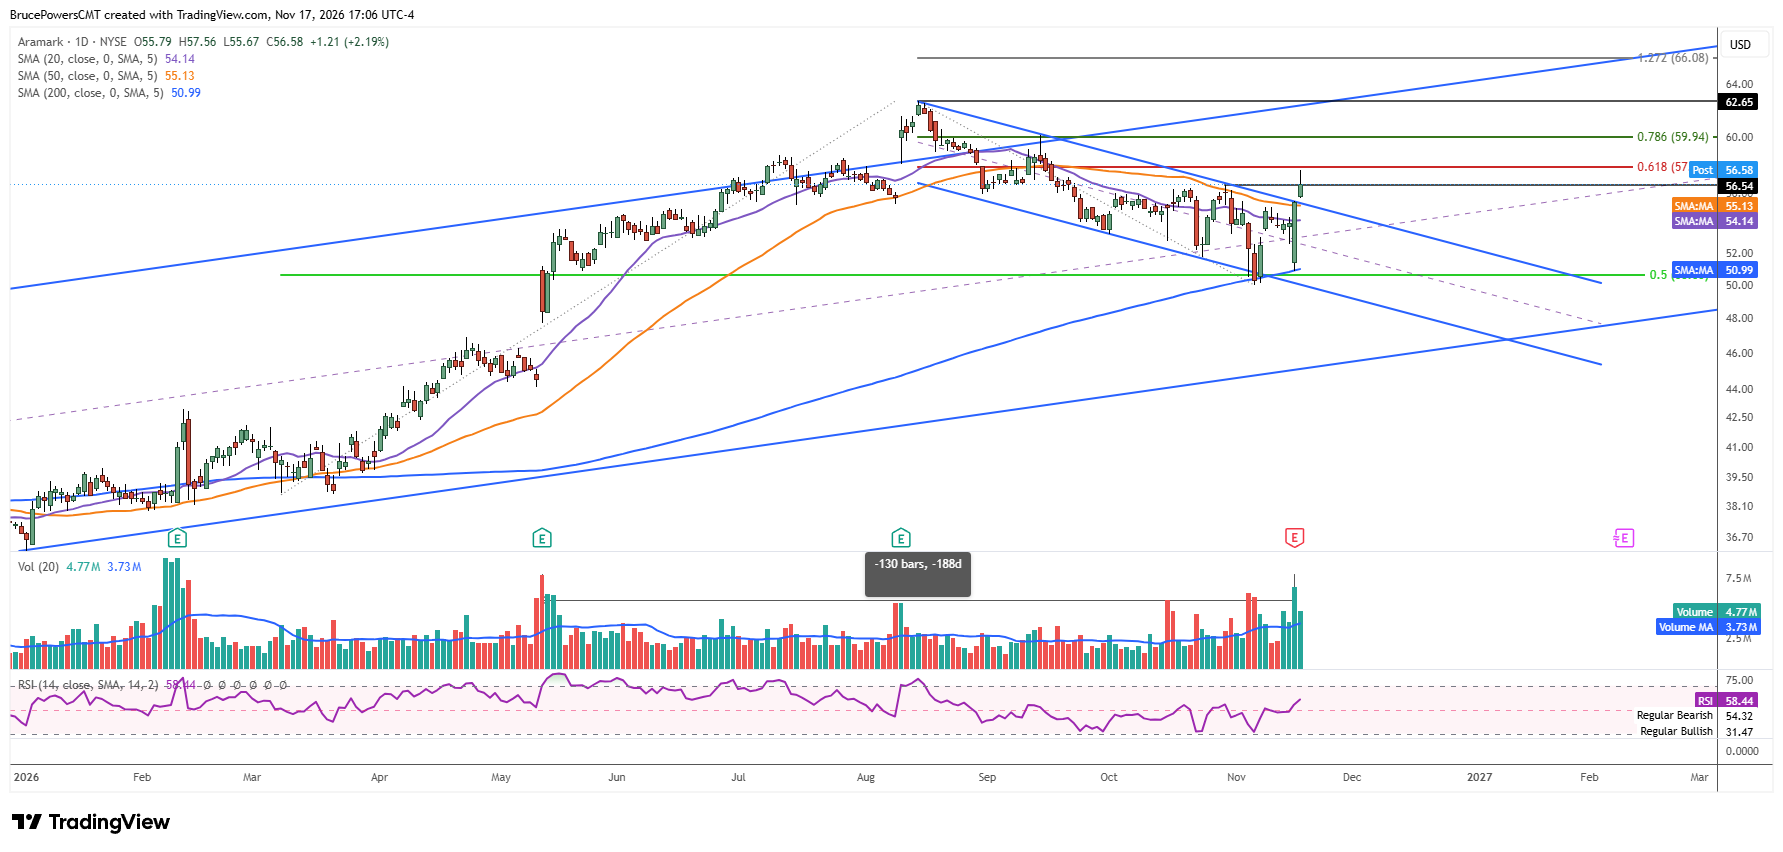
Aramark (ARMK) rallied sharply following Monday’s earnings report, bouncing from support at the 200-day moving average and triggering several bullish technical signals. The company provides goods, facilities, and uniform services globally. It reported earnings before the market opened on Monday, resulting in a sharp rally to a six-day high of $55.44. Volume spiked to a 130-day high, reflecting renewed interest from buyers.
50-Day Moving Average Reclaimed
Additionally, the 50-day moving average, a key resistance level near $55.11, was reclaimed with a daily close above it for the first time since September 15. The sharp advance extended during Tuesday’s session, adding to the bullish signals with a rally above the prior lower swing high of $56.54 and further confirming the reclaim of the 50-day moving average with a second close above it.
Correction Gives Way to Bullish Structure
Following a peak of $62.65 reached in August, ARMK retraced approximately 50% of its prior advance before establishing a low at $50.01 two weeks ago. Notably, that low established support at the 200-day moving average, which was tested for a secon time on Monday, adding to its significance and the likelihood that the bearish correction may be complete.
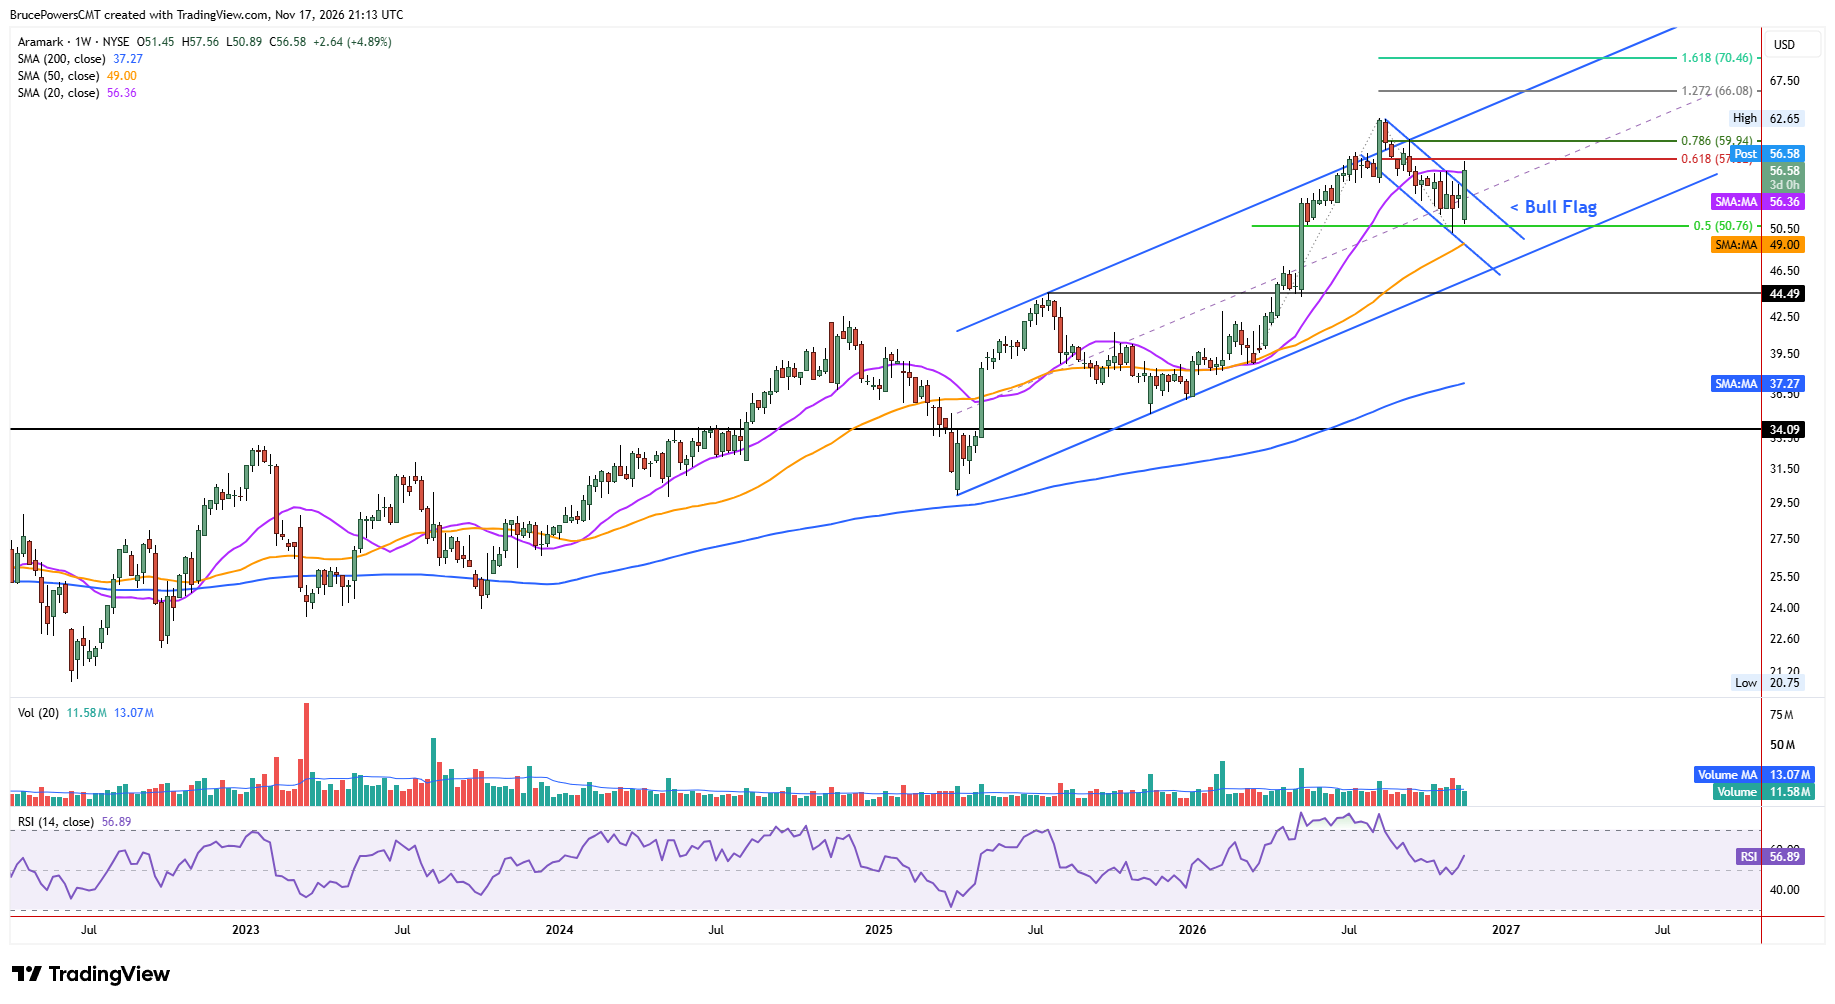
The recent correction eventually formed a bullish flag-type structure, most apparent on the weekly chart. A breakout of that pattern triggered on Tuesday, with a rise through a confluence zone represented by the top declining boundary of the pattern, aligned with the 50-day moving average and Monday’s high. Furthermore, the weekly chart has formed a bullish engulfing pattern, which will be confirmed with a weekly close above last week’s high of $55.02.
Monthly Chart Adds Another Bullish Signal
The higher-timeframe monthly chart adds to the bullish technical evidence, as an outside month has been established, with this month’s range encompassing the full range of the prior month, which had a high of $56.54. This matches the swing high on the daily chart and therefore adds to the significance of that price level.
Pullbacks Offer Next Opportunity
Although ARMK looks extended in the short term, traders will be watching for new opportunities during pullbacks to test support. An initial support range is defined by the 50-day moving average at $55.12 and the 20-day moving average near $54.13. Holding above this zone would help preserve the bullish momentum established by the recent breakout, following the successful defense of the 200-day moving average.
If you’d like to know more about technical analysis and how traders use it, please visit our educational area.