


Support Confluence Sparks a Rebound
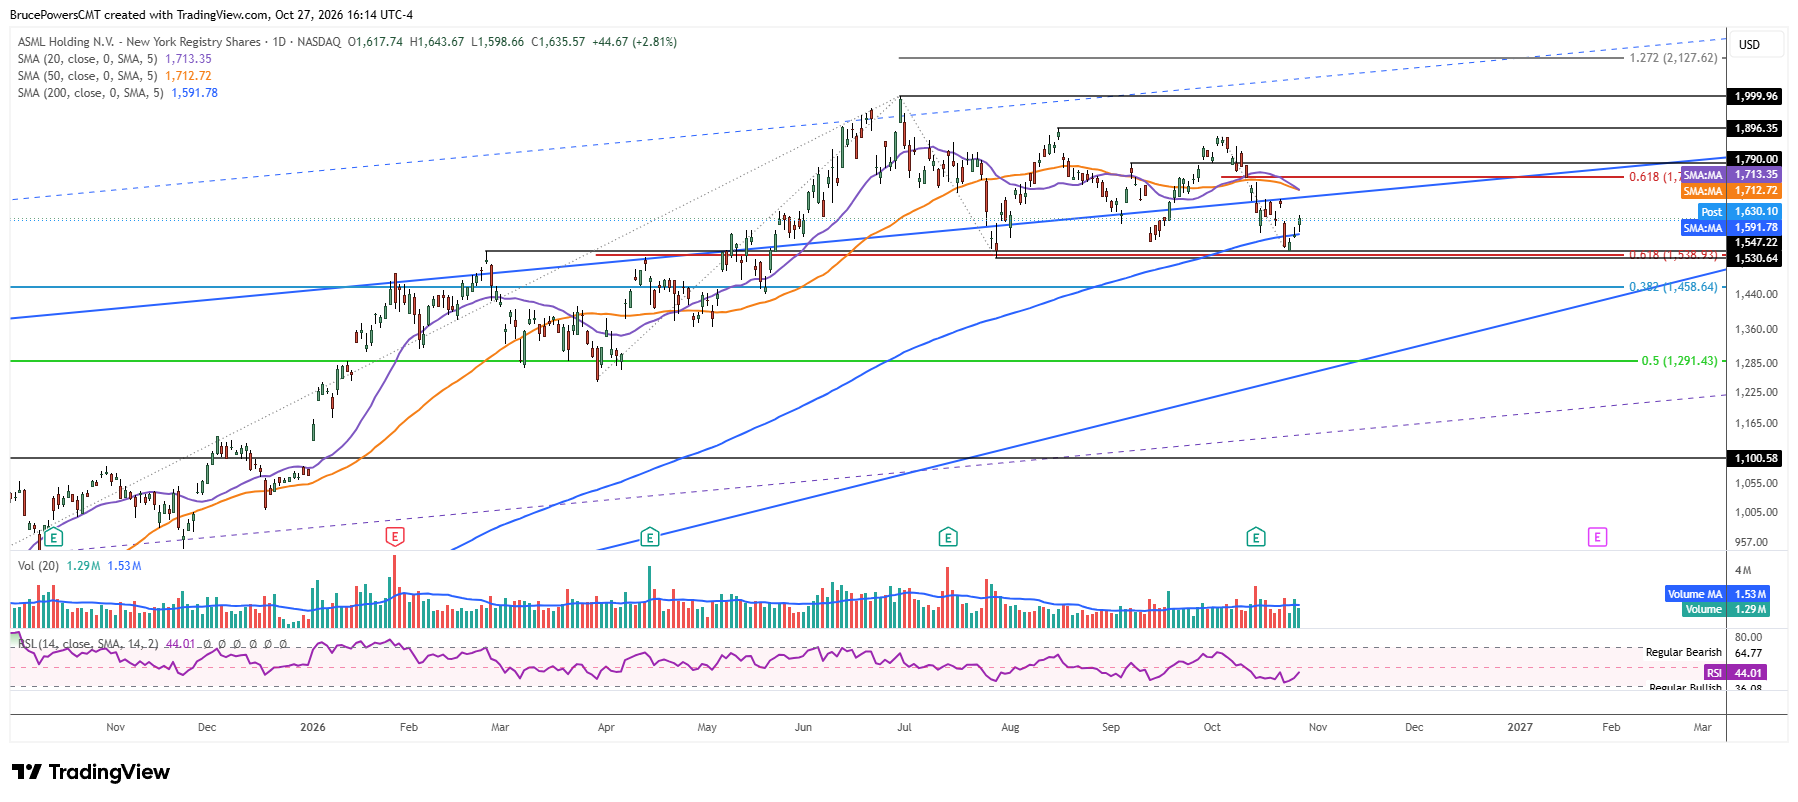
Although shares of ASML Holding N.V. (ASML), a leading Dutch semiconductor equipment manufacturer, remain in a large consolidation pattern that followed the June peak of $2,000, the stock reached a key support confluence zone last Friday, hitting a low of $1,550. That move took ASML below the 200-day moving average for the first time since August 2025. However, buyers emerged this week, triggering a daily-chart reversal signal and a reclaim of the 200-day moving average. Support is reinforced by the February high of $1,547, the 61.8% Fibonacci retracement of the prior short-term advance at $1,539, and the July low of $1,531.
Upper Range Offers Next Upside Target
This suggests that ASML may continue to advance toward the top of the consolidation range between $1,873 and $1,896, or higher. Although a continuation of the range is most likely, this first successful test of support near the 200-day moving average may have marked the bottom of the corrective phase. That could eventually result in a breakout above $1,896 and a move toward the June peak. For now, though, the top of the range remains the more likely target zone.
Rising Weekly Average Adds Support
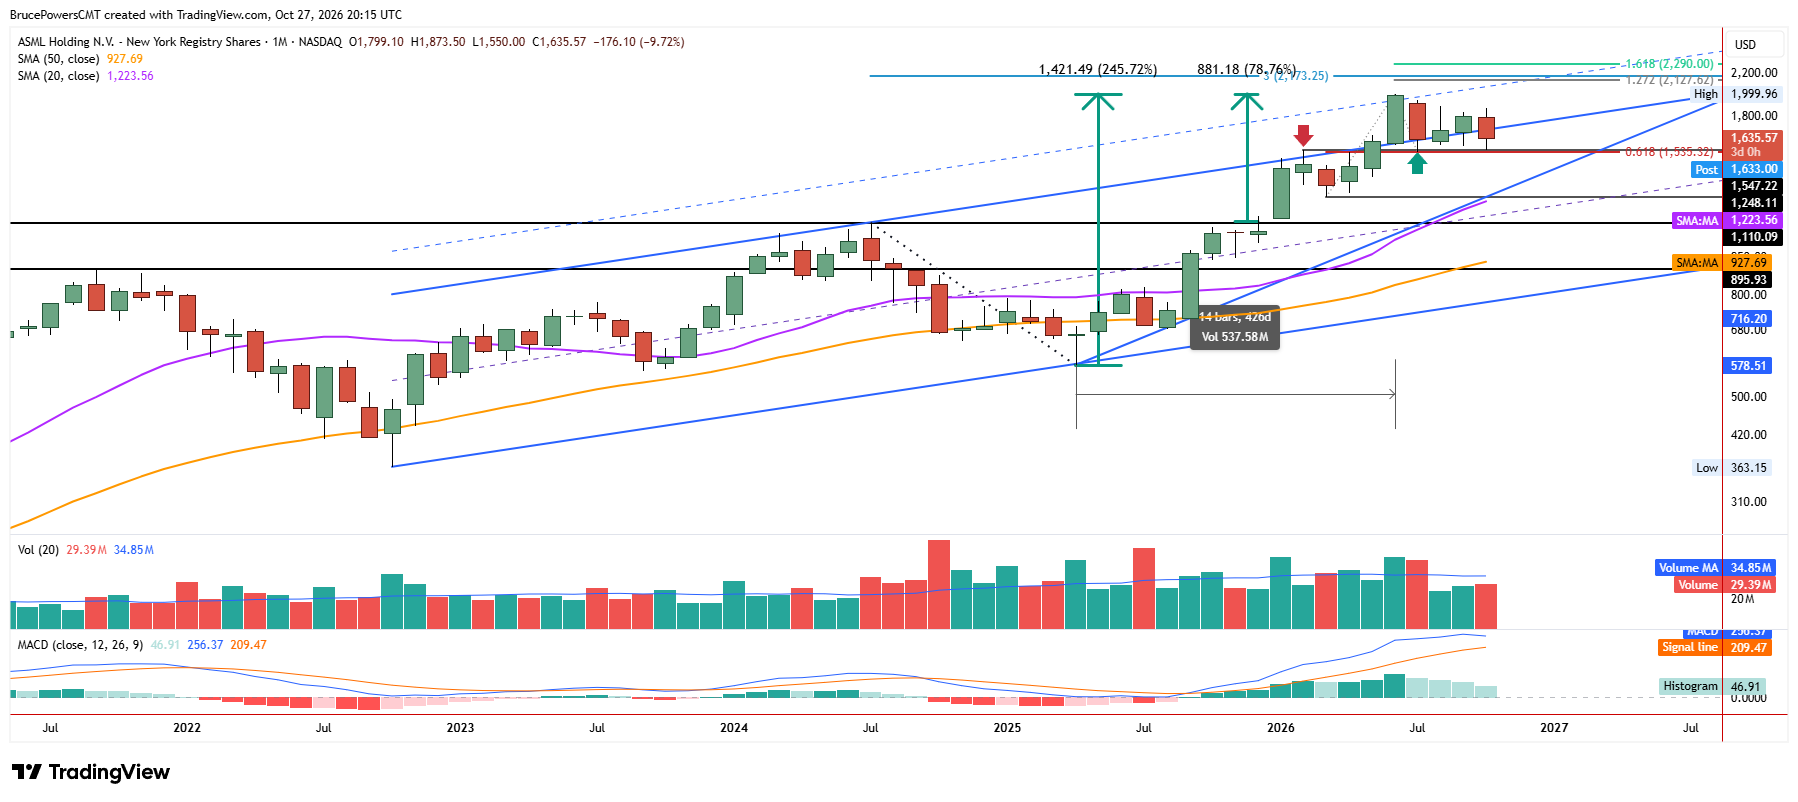
Dynamic support on the weekly chart is represented by the 50-week moving average, currently near $1,515 and rising. Since it is rising toward the $1,550 low, it will eventually move above that level, further strengthening the support zone. The 50-week moving average has not been tested as support since September 2025, and it is expected to hold on at least the first test. A break below it, however, would signal further weakness rather than strength.
Consolidation Could Precede Another Advance
The consolidation phase followed a gain of more than 245% over approximately 14 months. That advance highlights the potential for another sustained move higher once the corrective phase is complete. For now, the most likely scenario remains a continuation of the consolidation pattern, although an eventual upside breakout is also possible. The recent rebound from the confluence of support levels strengthens the case for a recovery toward the upper end of the range, with an eventual breakout above $1,896 providing stronger evidence that the larger advance is resuming.
If you’d like to know more about technical analysis and how traders use it, please visit our educational area.