



The AUD/USD is trading flat shortly before the U.S. opening and the release of the March U.S. Non-Farm Payrolls report. Traders are also monitoring appetite for risk after President Trump sent the Aussie sharply lower late Thursday and early Friday with his threat of additional tariffs against China.
Daily Swing Chart Technical Analysis
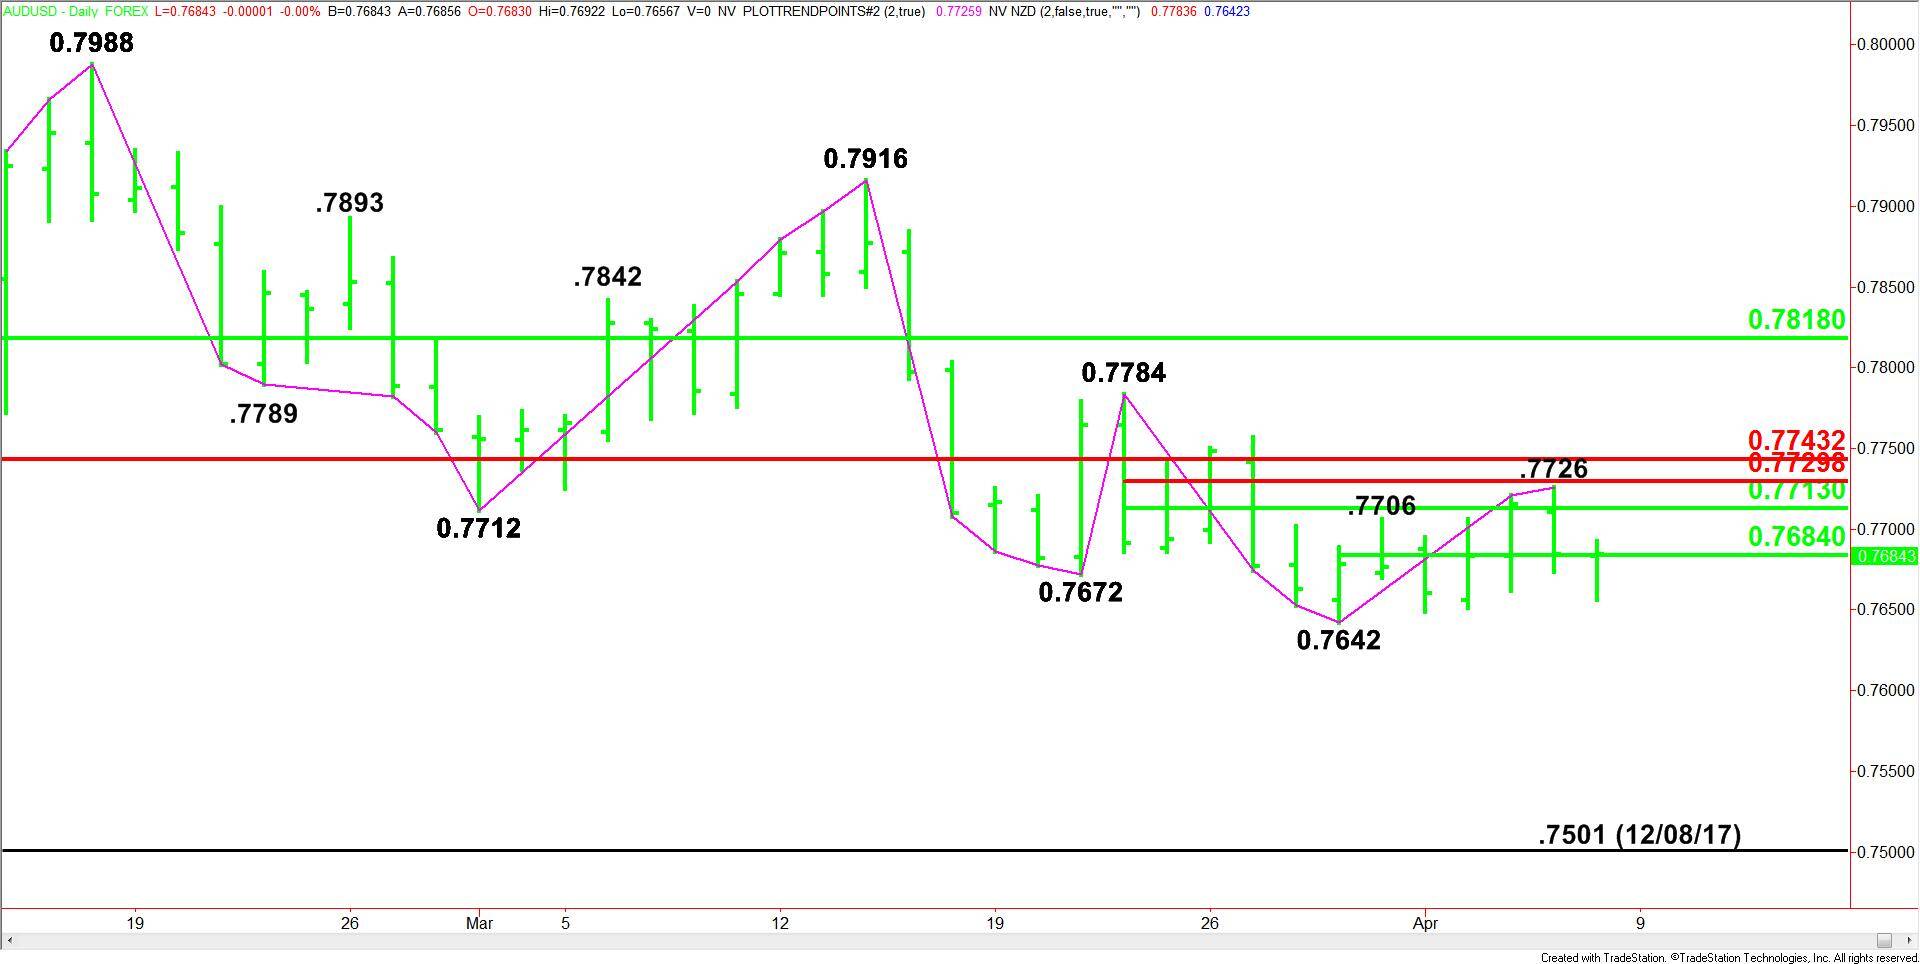
The main trend is down according to the daily swing chart. A trade through .7642 will signal a resumption of the downtrend. The main trend will change to up on a move through .7784.
The minor trend is up. It turns down on a move through .7649. A trade through .7726 will shift momentum to the upside.
The short-term range is .7642 to .7726. Its 50% level or pivot is .7684. This price is controlling the direction of the AUD/USD today.
The intermediate range is .7784 to .7642. Its retracement zone at .7713 to .7730 is resistance along with a major Fibonacci level at .7743. This zone stopped the rally on Thursday.
Daily Swing Chart Technical Forecast
Based on the early price action, the direction of the AUD/USD is likely to be determined by trader reaction to the pivot at .7684.
A sustained move over .7684 will indicate the return of buyers. This could create the upside momentum needed to challenge a series of levels at .7713, .7726. .7730 and .7743. The latter is a potential trigger point for an acceleration to the upside.
A sustained move under .7684 will signal the presence of sellers. This move could create the downside momentum needed to challenge the minor bottom at .7649 then the main bottom at .7642.
The main bottom is a potential trigger point for an acceleration to the downside because the daily chart indicates the nearest support doesn’t come in until .7501.