



The Australian Dollar is trading lower on Tuesday on light volume. The Forex pair is also trading inside yesterday’s range, which suggests investor indecision and impending volatility. There were no economic reports early Tuesday. However, traders are reacting to new concerns about the lack of clarity over U.S.-China trade relations. Weaker energy prices are also weighing on the currency.
At 06:00 GMT, the AUD/USD is trading .7155, down 0.0014 or -0.19%.
Traders have also taken to the sidelines ahead of a slew of U.S. economic data and the first day of Congressional testimony by Fed Chair Jerome Powell. His comments on interest rates and monetary policy could trigger a volatile reaction.
Daily Technical Analysis
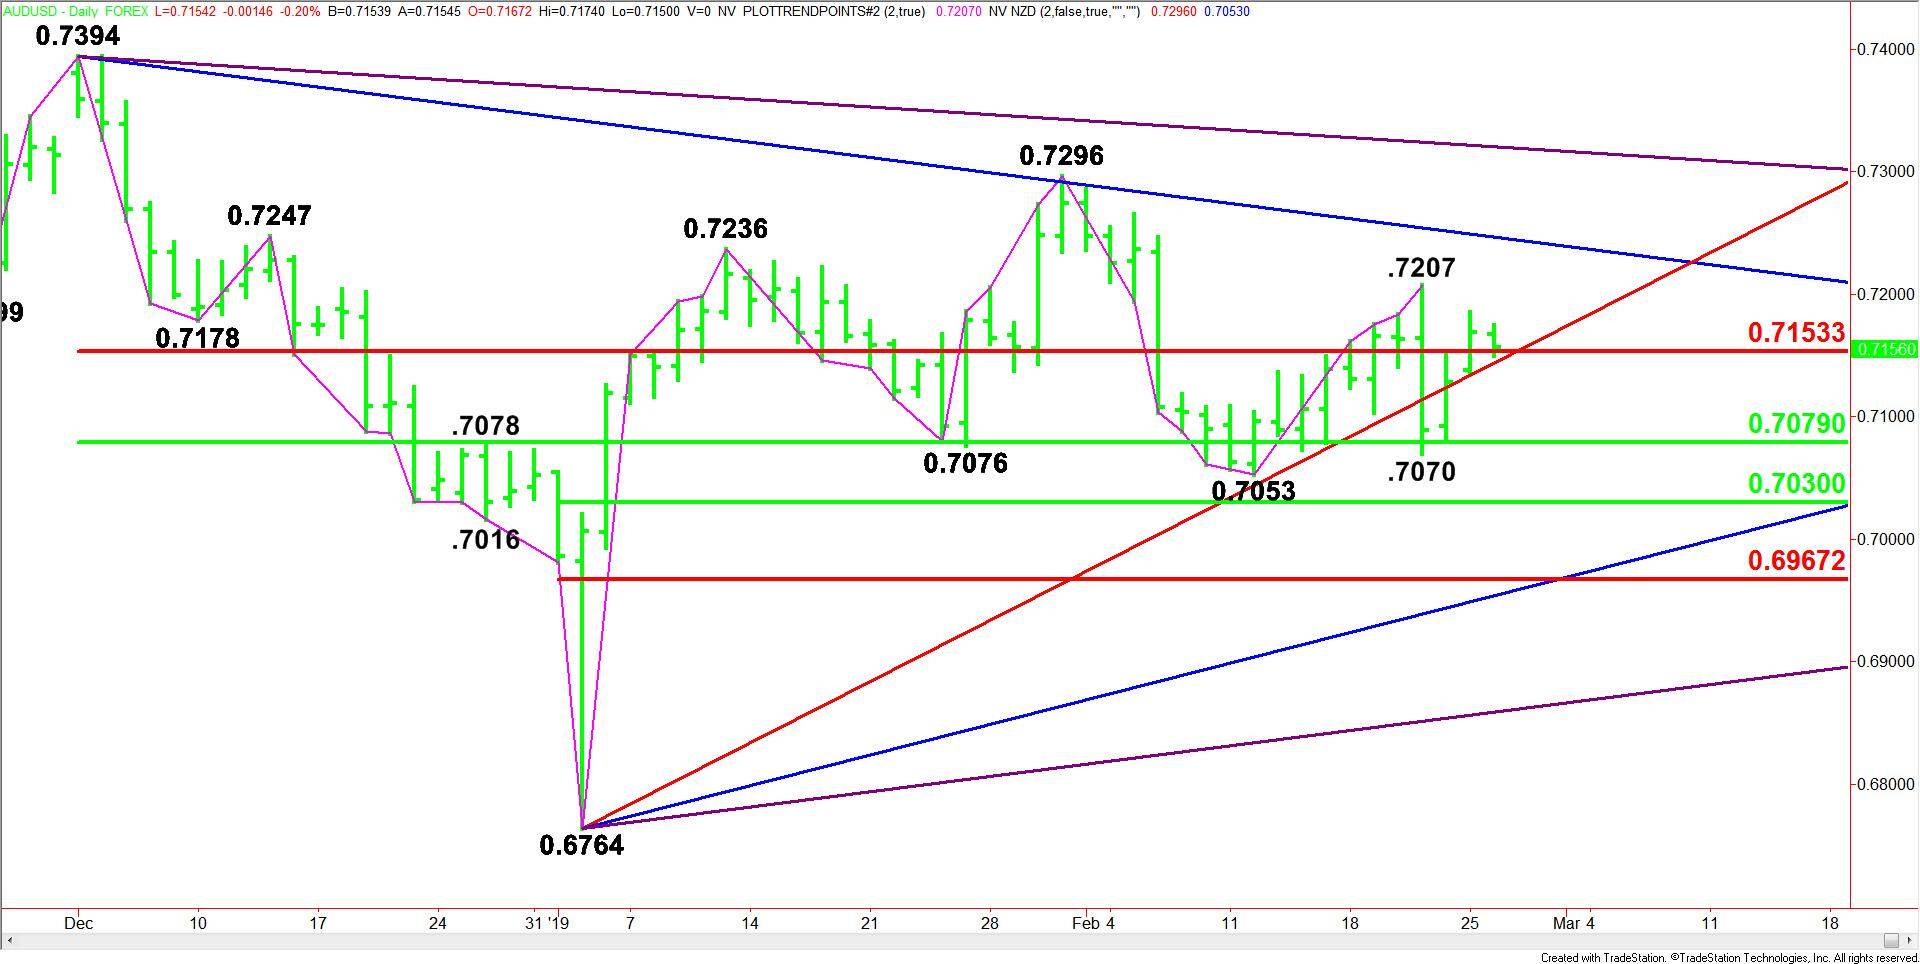
The main trend is down according to the daily swing chart. The main trend will change to up on a trade through .7296. A trade through .7053 will signal a resumption of the downtrend.
The minor trend is also down. A trade through .7207 will change the minor trend to up. This will also shift momentum to the upside. A move through .7070 will indicate the selling is getting stronger.
The main range is .7394 to .6764. Its retracement zone at .7153 to .7079 is controlling the near-term direction of the Forex pair. Currently, the Aussie is trading on the strong side of this zone, giving it a slightly upside bias.
The short-term range is .6764 to .7296. If the downtrend resumes then look for a possible drive into its retracement zone at .7030 to .6967.
Daily Technical Forecast
Based on the early price action, the direction of the AUD/USD on Tuesday is likely to be determined by trader reaction to the Fibonacci level at .7153 and the uptrending Gann angle at .7144.
Bullish Scenario
A sustained move over .7153 will indicate the presence of buyers. If this move creates enough upside momentum, we could see a short-covering rally strong enough to drive the AUD/USD into .7207. Taking out this level could trigger a rally into a long-term downtrending Gann angle at .7247.
Bearish Scenario
A sustained move under .7144 will signal the presence of sellers. The daily chart is wide open under this angle with the next major target the 50% level at .7079. Taking out this level and the minor bottom at .7070 could trigger a further break into the main bottom at .7053, followed by a 50% level at .7030.