



Rising U.S. Treasury yields helped drive the Australian Dollar lower against the U.S. Dollar last week. The tightening of the spread between U.S. Government Bonds and Australian Government Bonds helped make the U.S. Dollar a more attractive investment.
The AUD/USD settled the week at .7579, down 0.0090 or -1.17%.
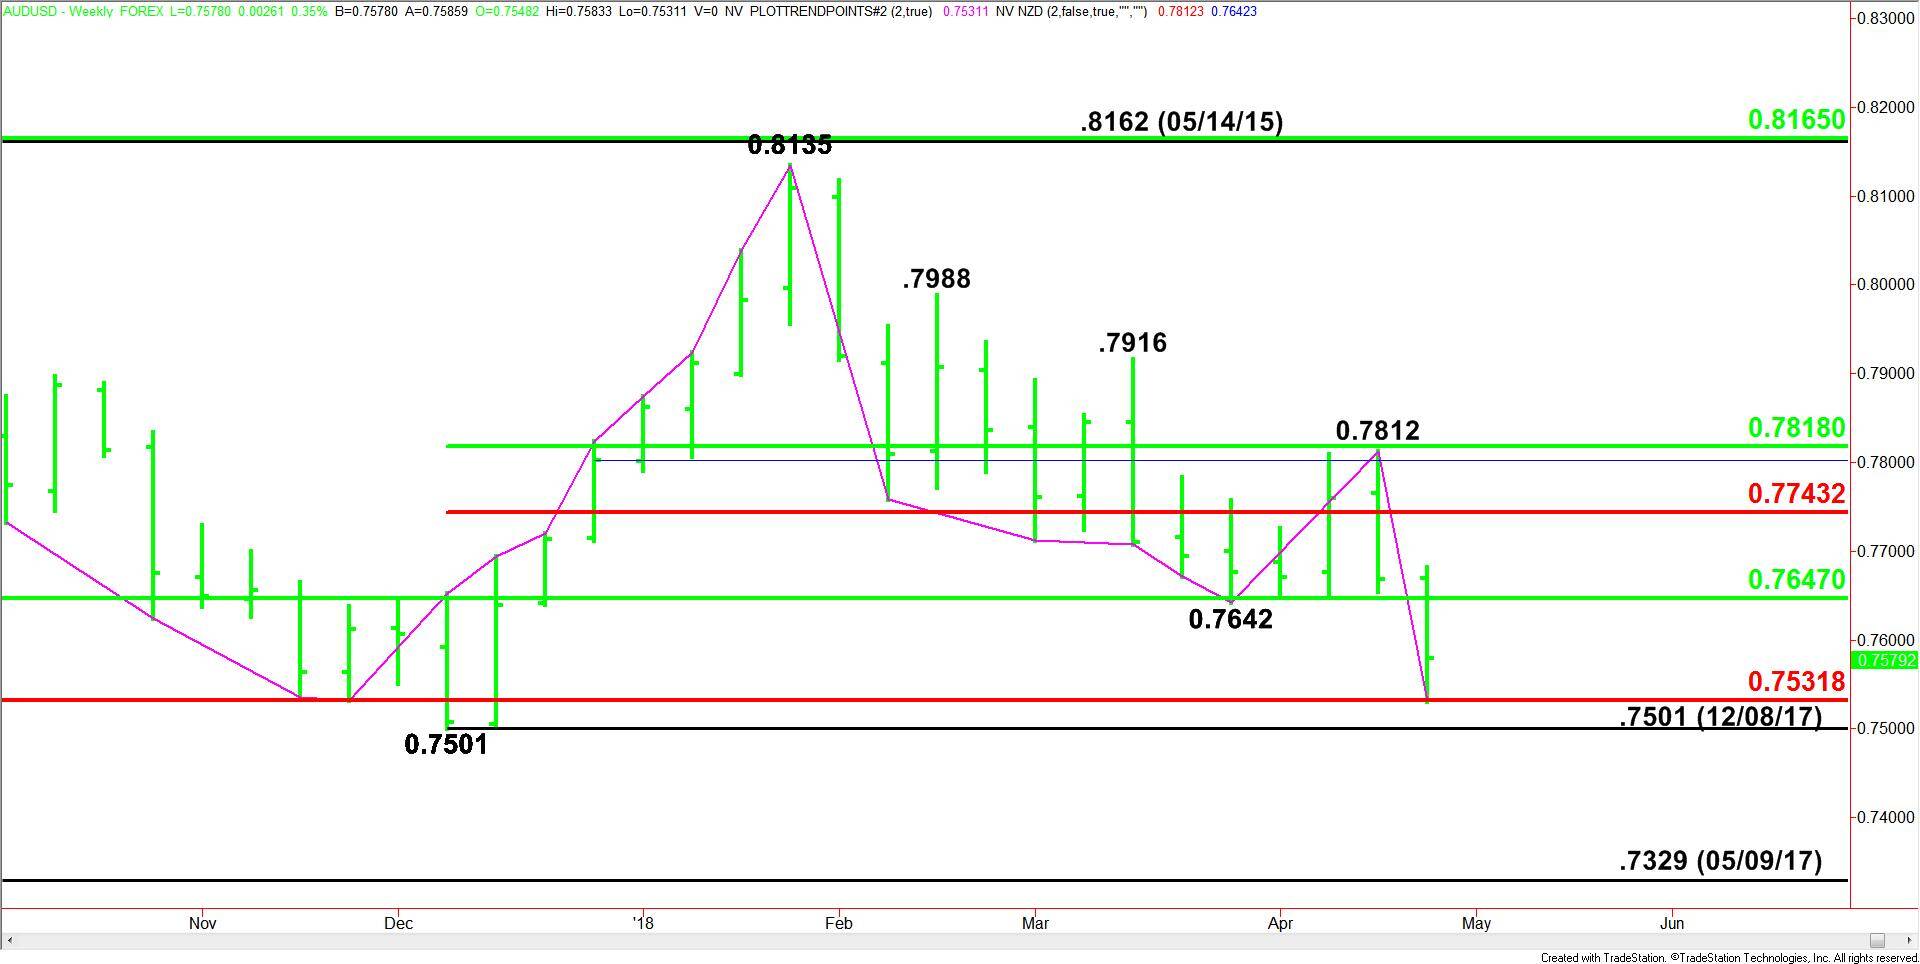
Weekly Swing Chart Technical Analysis
The main trend is down according to the weekly swing chart. The trade through the previous main bottom at .7642 reaffirmed the downtrend. A trade through .7812 will change the main trend to up.
The AUD/USD is also trading lower for the year, helping to contribute to the downside bias.
The short-term range is .7501 to .8135. Its retracement zone at .7743 to .7818 is new resistance.
The main range is .7159 to .8135. Its retracement zone at .7647 to .7532 is currently being tested.
Weekly Swing Chart Technical Forecast
Based on last week’s price action, the direction of the AUD/USD this week is likely to be determined by trader reaction to the main Fibonacci level at .7532.
Holding above .7532 will signal the presence of buyers. If this creates enough upside momentum, we could see a retest of the main 50% level at .7647. Since the main trend is down, we could see sellers return on the first test of this level. This price is also a potential trigger point for an acceleration into the short-term Fib level at .7743.
A sustained move under .7532 will indicate the presence of sellers. This could lead to a quick test of the December 8 bottom at .7501. Aggressive counter-trend buyers could come in on the first test of this level.
Look for the start of a steep break if .7501 is taken out with rising volume. The next downside target is the May 9, 2017 main bottom at .7329.