



The Australian Dollar is trading higher on Wednesday, but inside yesterday’s wide range. This suggests investor indecision and impending volatility. It could also mean that the currency is going through a transition period.
For weeks, traders had been pricing in an interest rate cut by the Reserve Bank of Australia. When that didn’t happen on Tuesday, short-sellers were forced to cover, triggering yesterday’s rally.
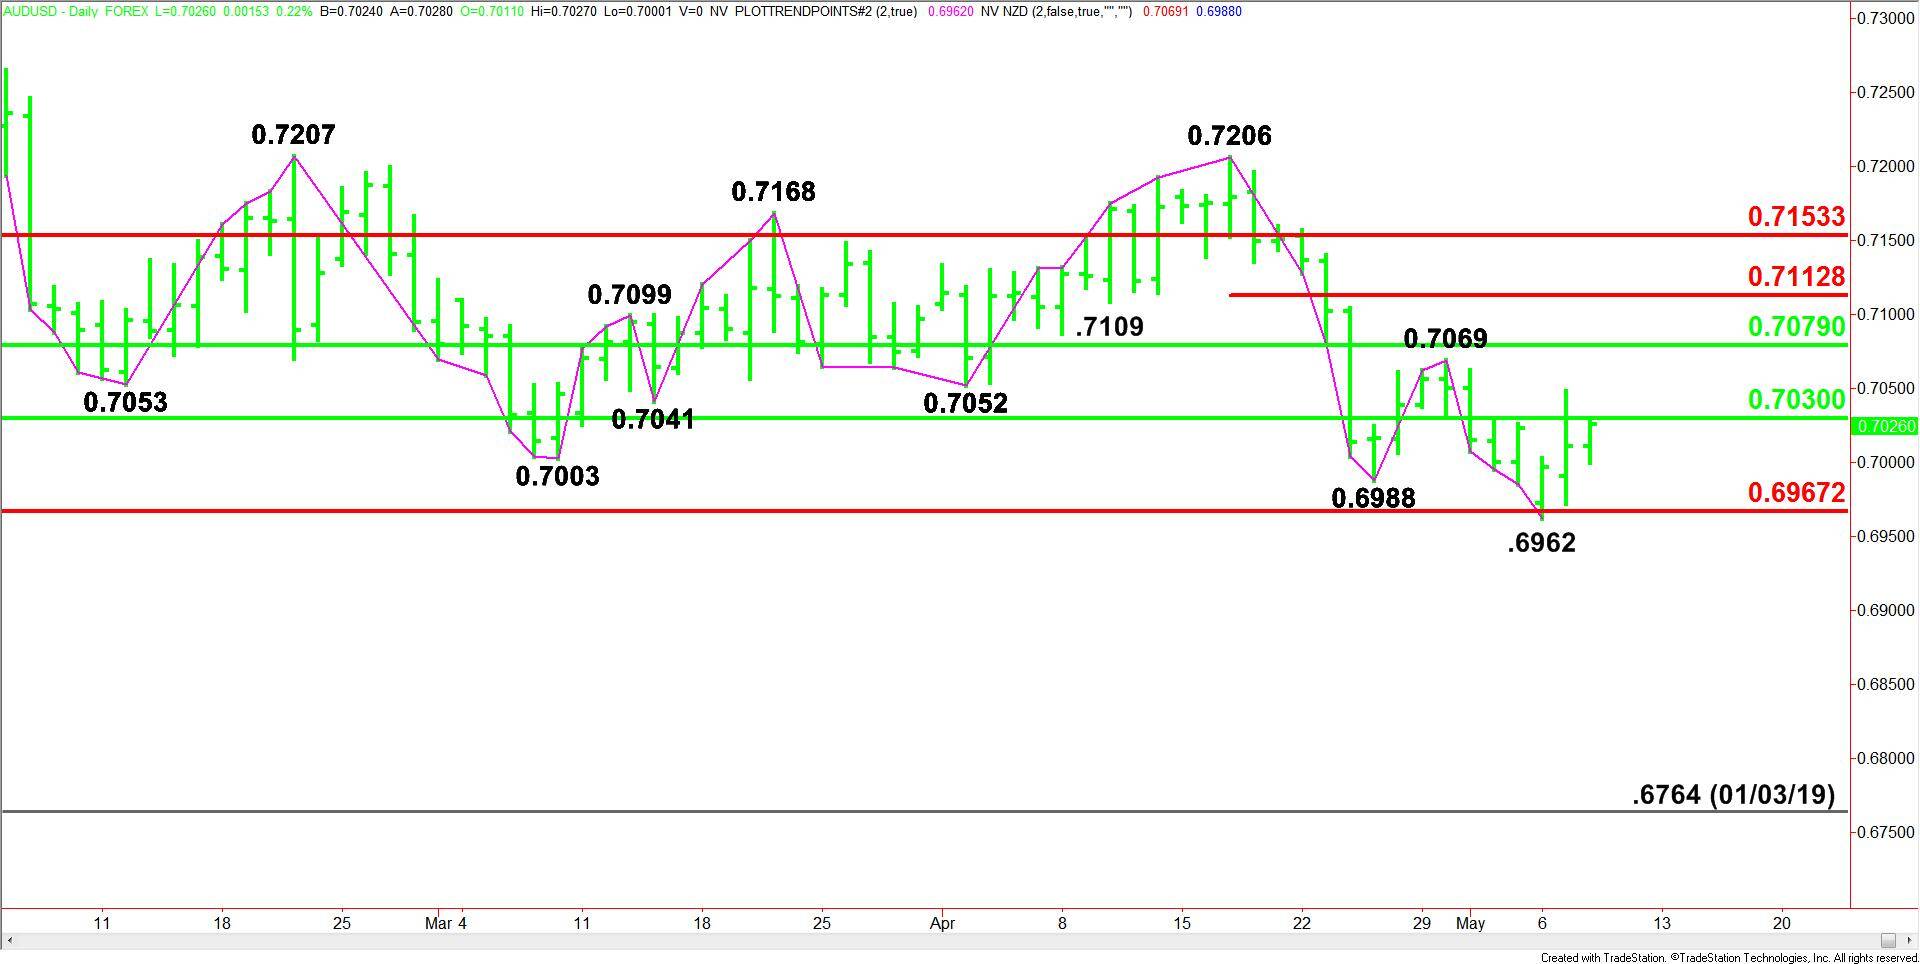
Daily Swing Chart Technical Analysis
The main trend is down according to the daily swing chart. However, momentum has been trending higher since the closing price reversal bottom on May 6 and the subsequent confirmation on Tuesday.
The main trend will change to up on a trade through .7069. A trade through .6962 will negate the closing price reversal bottom and signal a resumption of the downtrend.
The bottom at .6962 is very important because it is potentially the last support before the January 3 bottom at .6764.
One main range is .6764 to .7296. Traders have been trying to establish a support base inside its retracement zone at .7030 to .6967 for about two weeks.
The second main range is .7394 to .6764. Its retracement zone at .7079 to .7153 is the next upside target. This zone is controlling the longer-term direction of the AUD/USD. As long as the rate cuts remain on the table, sellers are likely to come in on a test of this resistance zone.
The short-term range is .7206 to .6962. Its retracement zone at .7084 to .7113 is additional resistance.
Daily Swing Chart Technical Forecast
Based on the early price action, the direction of the AUD/USD on Wednesday is likely to be determined by trader reaction to the 50% level at .7030.
Bullish Scenario
A sustained move over .7030 will indicate the presence of buyers. This could trigger a rally into the main top at .7069. Taking out this top will change the main trend to up. This should lead to a quick test of the main 50% resistance cluster at .7079 to .7084.
Bearish Scenario
A sustained move under .7030 will signal the presence of sellers. If this move creates enough downside momentum then look for a possible retest of the Fibonacci level at .6967 and this week’s low at .6962.
The daily chart indicates there is plenty of room to the downside if heavy selling volume comes in on a break under .6962.