



The Australian Dollar traded at its lowest level since February 9 on Wednesday, dragged down by weakness in stocks and commodities. Weakness in crude oil and iron ore markets contributed to the price drop, along with a late decline on Wall Street.
On Wednesday, the AUD/USD settled at .7761, down 0.0028 or -0.35%.
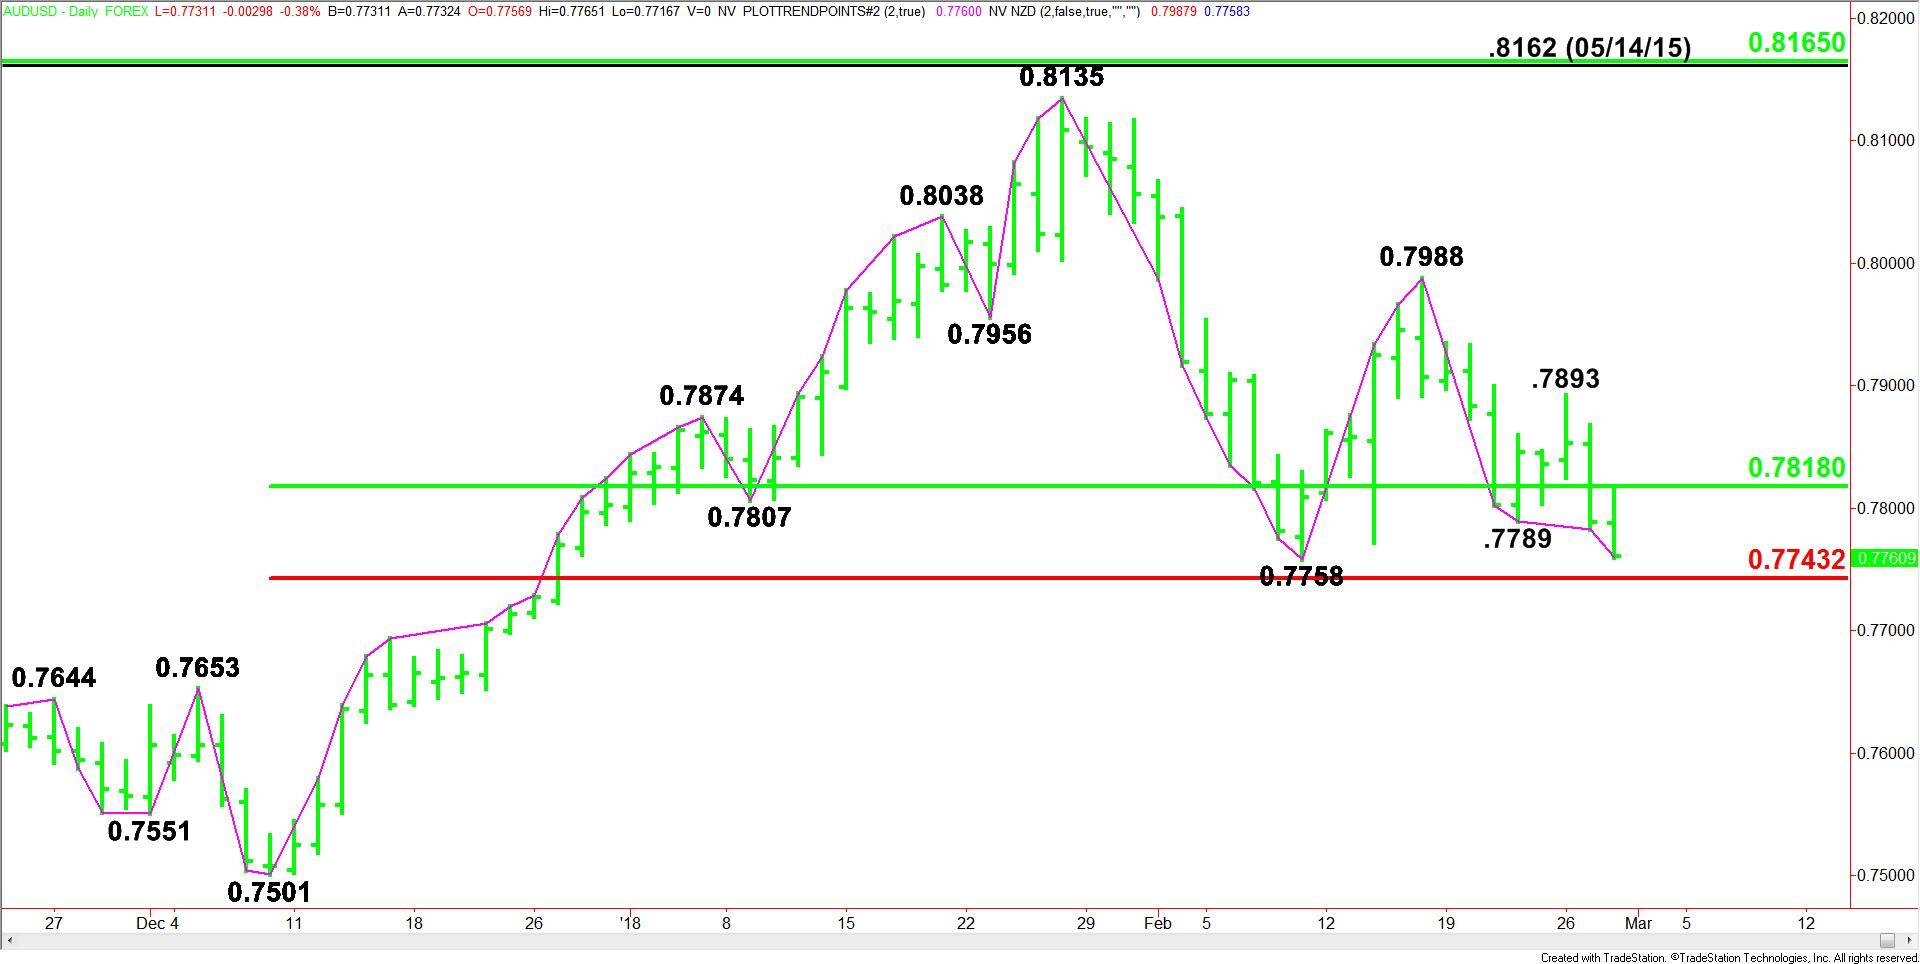
Daily Swing Chart Technical Analysis
The main trend is down according to the daily swing chart. The downtrend resumed after seller took out the minor bottom at .7789. A trade through .7758 will reaffirm the downtrend.
The main range is .7501 to .8135. Its retracement zone at .7818 to .7743 is currently being tested. This zone is controlling the longer-term direction of the Forex pair.
The daily chart is wide open under the Fibonacci level at .7743 so investors should not be surprised by an acceleration to the downside if this level is taken out with conviction. The next major target is the December 8 main bottom at .7501.
Daily Swing Chart Technical Forecast
Based on the weak close and the downside momentum at the finish of the session, traders are likely to go after the main bottom at .7758 early in the session. Taking out this level will reaffirm the downtrend. This should lead to a quick test of .7743.
Taking out .7743 with rising volume will signal the presence of sellers. If this price becomes new resistance then look for the start of an acceleration to the downside.