



The Australian Dollar closed higher last week with most of the strength fueled by the dovish tone in the Fed minutes and a drop in U.S. Treasury yields. On Friday, however, the currency gave back most of its earlier gains when a steep drop in crude oil drove down demand for commodity-linked currencies.
The AUD/USD finished the week at .7547, up 0.0035 or +0.47%.
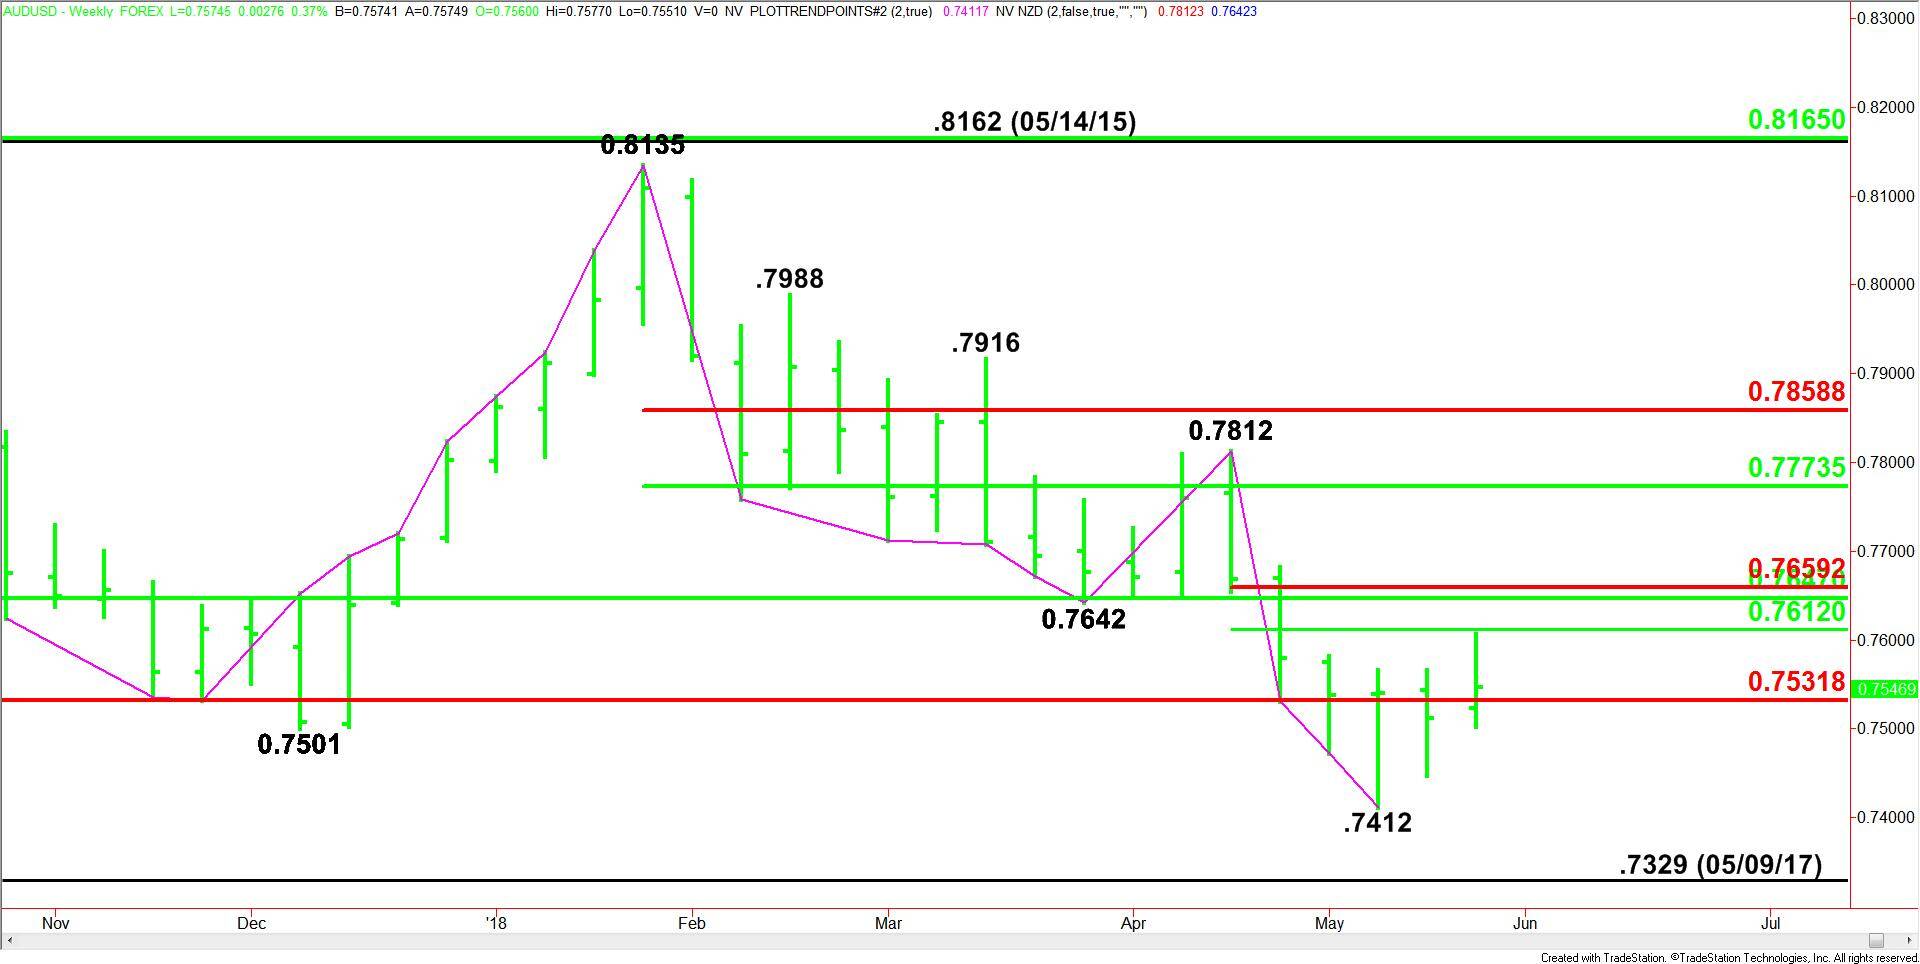
Weekly Swing Chart Technical Analysis
The main trend is down according to the weekly swing chart. A trade through .7412 will signal a resumption of the downtrend.
The AUD/USD is currently straddling a major Fibonacci level at .7532. This is support.
The short-term range is .7812 to .7412. Its retracement zone at .7612 to .7659 is the primary upside target. The lower level of this range stopped the rally last week.
Inside the short-term retracement zone is a major 50% level at .7647. This creates a potential resistance cluster with the short-term Fibonacci level at .7659. Since the main trend is down, sellers are likely to show up on a test of this area.
Weekly Swing Chart Technical Forecast
Since the 50% price at .7612 stopped the rally last week, this level is likely to determine the direction of the AUD/USD this week.
A sustained move under .7612 will indicate the presence of sellers. This could lead to a test of the major Fib level at .7532. This level is a potential trigger point for an acceleration to the downside with the next major downside targets the bottom at .7412 and the May 9, 2017 main bottom at .7329.
Overtaking and sustaining a move over .7612 will signal the presence of buyers. This could drive the AUD/USD into the potential resistance cluster at .7647 to .7659.
The trigger point for an acceleration to the upside is .7659. Taking out this level with conviction could lead to an eventual test of .7773 and .7812.
A short-term bottom may be forming, but given the fundamentals, I don’t think the buying is going to be strong enough to change the main trend to up.