



The Australian Dollar traded lower against the Greenback on Wednesday, declining to its lowest level for the year. The price action was dictated by a combination of end-of-the-month and end-of-the-quarter position-squaring, a stronger-than-expected US. Q4 GDP report and hawkish comments from a high-ranking U.S. Federal Reserve official.
The AUD/USD settled at .7663, down 0.0014 or -0.19%.
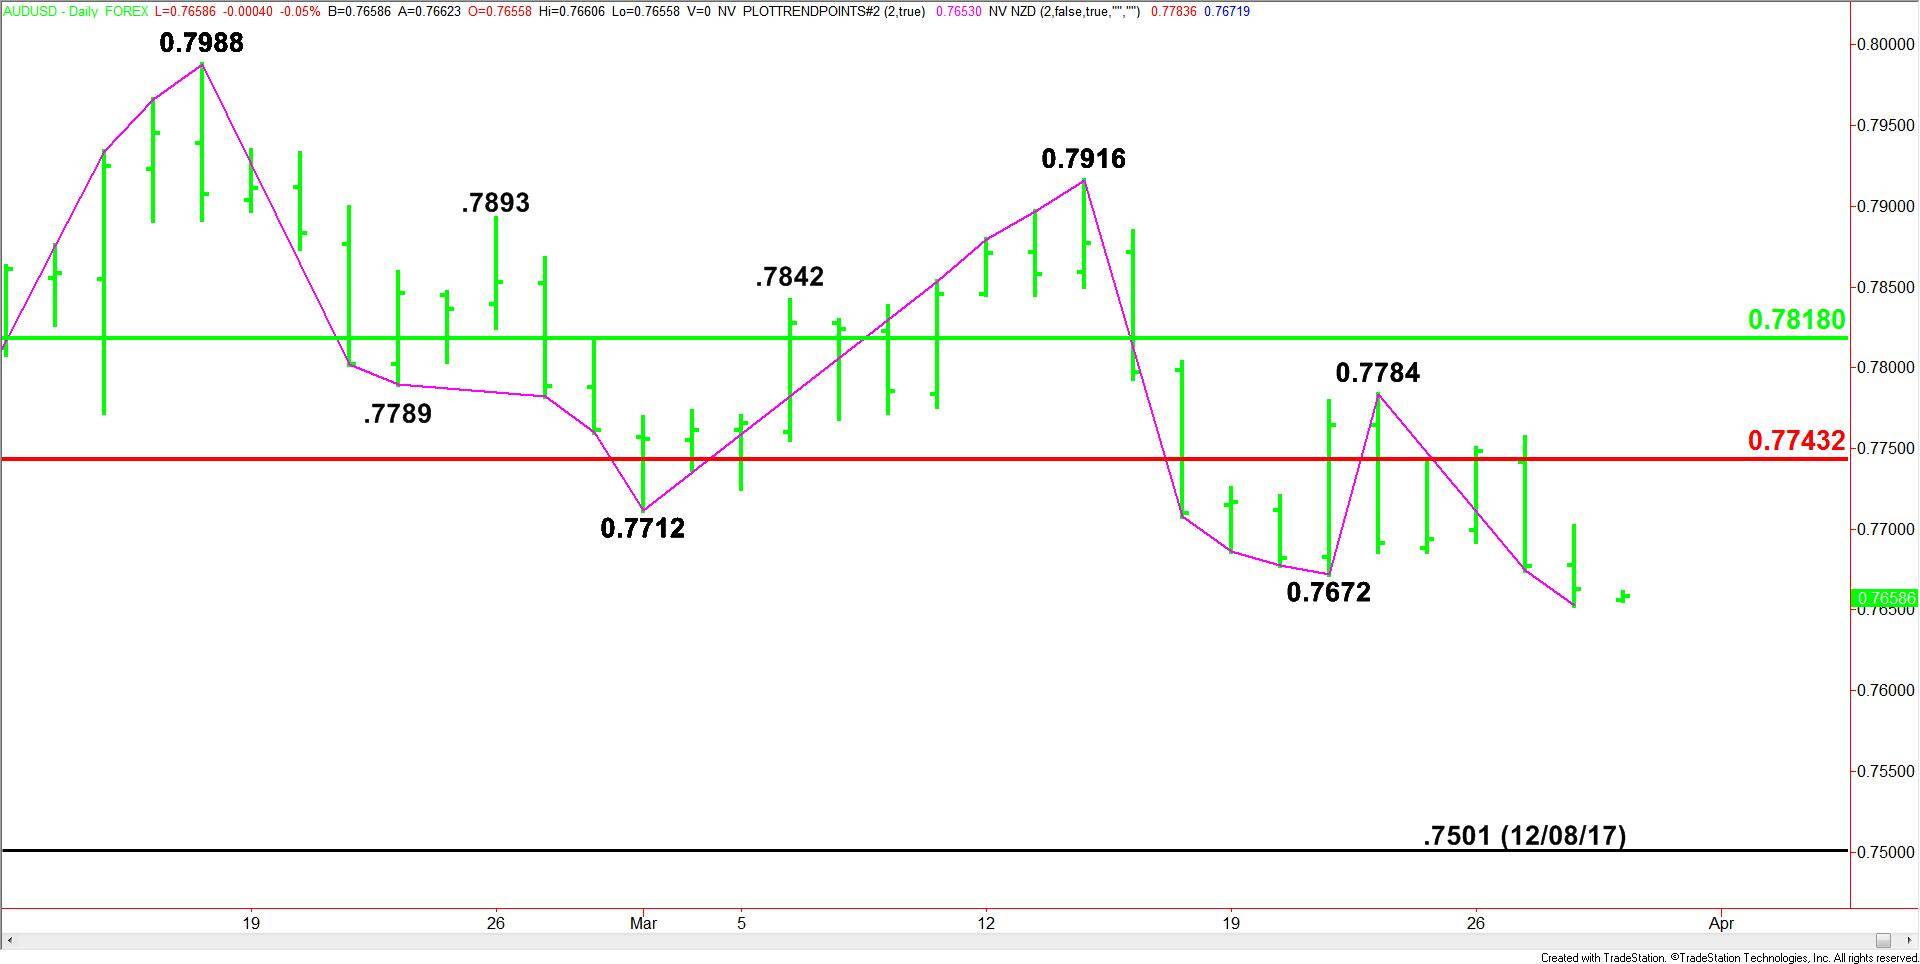
Daily Swing Chart Technical Analysis
The main trend is down according to the daily swing chart. The main trend will change to up on a trade through .7784.
The daily swing chart indicates there is plenty of room to the downside under the last main bottom at .7672 with the next major target the December 8 main bottom at .7501.
The Forex pair is also trading on the weak side of a major retracement zone at .7743 to .7818. This zone is controlling the longer-term direction of the AUD/USD. It should also be considered resistance.
Daily Swing Chart Technical Forecast
Based on Wednesday’s close at .7663, the direction of the AUD/USD early Thursday is likely to be determined by trader reaction to the previous main bottom at .7672.
A sustained move under .7672 will indicate the presence of sellers. The Forex pair could start to accelerate under this level if the selling volume starts to increase. The daily chart shows there is room to run to .7501.
Overtaking and sustaining a move over .7672 will signal the return of buyers. If this move generates enough upside momentum, we could see a retest of the major Fib level at .7743. Overtaking this level will indicate the short-covering is getting stronger.