



The AUD/USD is trending lower on Thursday. The Forex pair is feeling the effects of an intervention by the Reserve Bank of Australia and weaker-than-expected trade balance data. Later today, investors will get the opportunity to react to a number of U.S. economic reports. Any reports that indicate weak inflation or growth will likely be bearish for the U.S. Dollar because they will reduce the chances of a Fed rate hike later this year. This news could help underpin the Aussie.
Technical Analysis
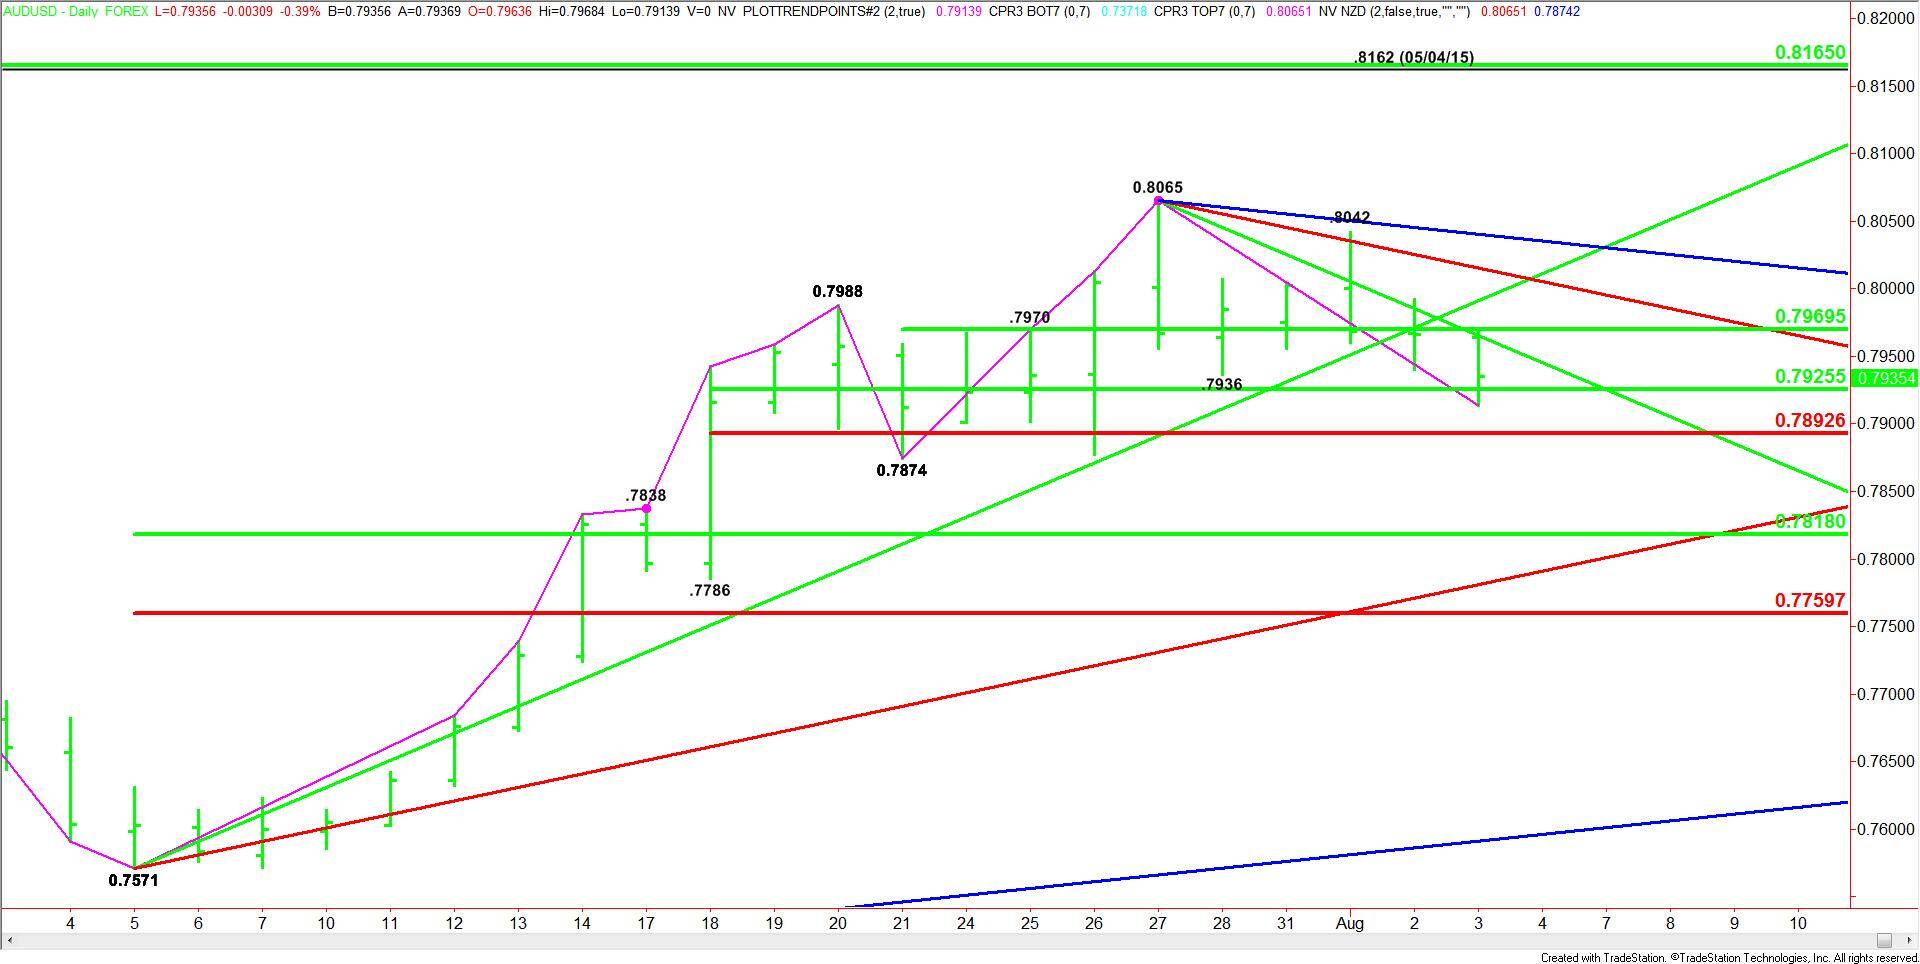
The main trend is up according to the daily swing chart, but momentum has been trending lower since the formation of the closing price reversal top at .8065 on July 27.
A trade through .8065 will negate the closing price reversal chart pattern and signal a resumption of the uptrend. The main trend will change to down on a trade through the main bottom at .7874.
On the upside a 50% level at .7969 is providing resistance.
50% level support is .7925, followed by Fibonacci support at .7893.
Taking out .7874 could trigger an acceleration to the downside with the primary target the major retracement zone at .7818 to .7759.
Forecast
Based on the current price at .7932 and the earlier price action, the direction of the AUD/USD the rest of the session will be determined by trader reaction to the 50% level at .7925.
A sustained move over .7925 will indicate the presence of buyers. This could drive the AUD/USD into a downtrending angle at .7965. This is followed closely by the 50% level at .7969. The latter is a trigger point for an acceleration into angles at .8015 and .8040.
A sustained move under .7925 will signal the presence of sellers. This could trigger a move into .7892 then .7874.
Look out to the downside if .7874 is taken out with conviction, the next major target comes in at .7818.
The decision for traders at this time is whether to continue to sell weakness against the trend and hope for a break through .7874, or wait for a retracement of the first leg down from the top and the formation of a secondary lower top.