



Strong U.S. economic data and increasing odds of a Fed rate hike later this year are putting pressure on the AUD/USD on Thursday. Traders are also reacting to China’s Non-Manufacturing PMI data that came in below expectations. Increased demand for risky assets may be limiting losses.
Later today, investors will get the opportunity to react to a slew of U.S. economic data with the most important reports the Core PCE Price Index, Personal Spending and Personal Income.
Volume may drop off after the reaction to the economic data because of Friday’s U.S. Non-Farm Payrolls report.
Technical Analysis
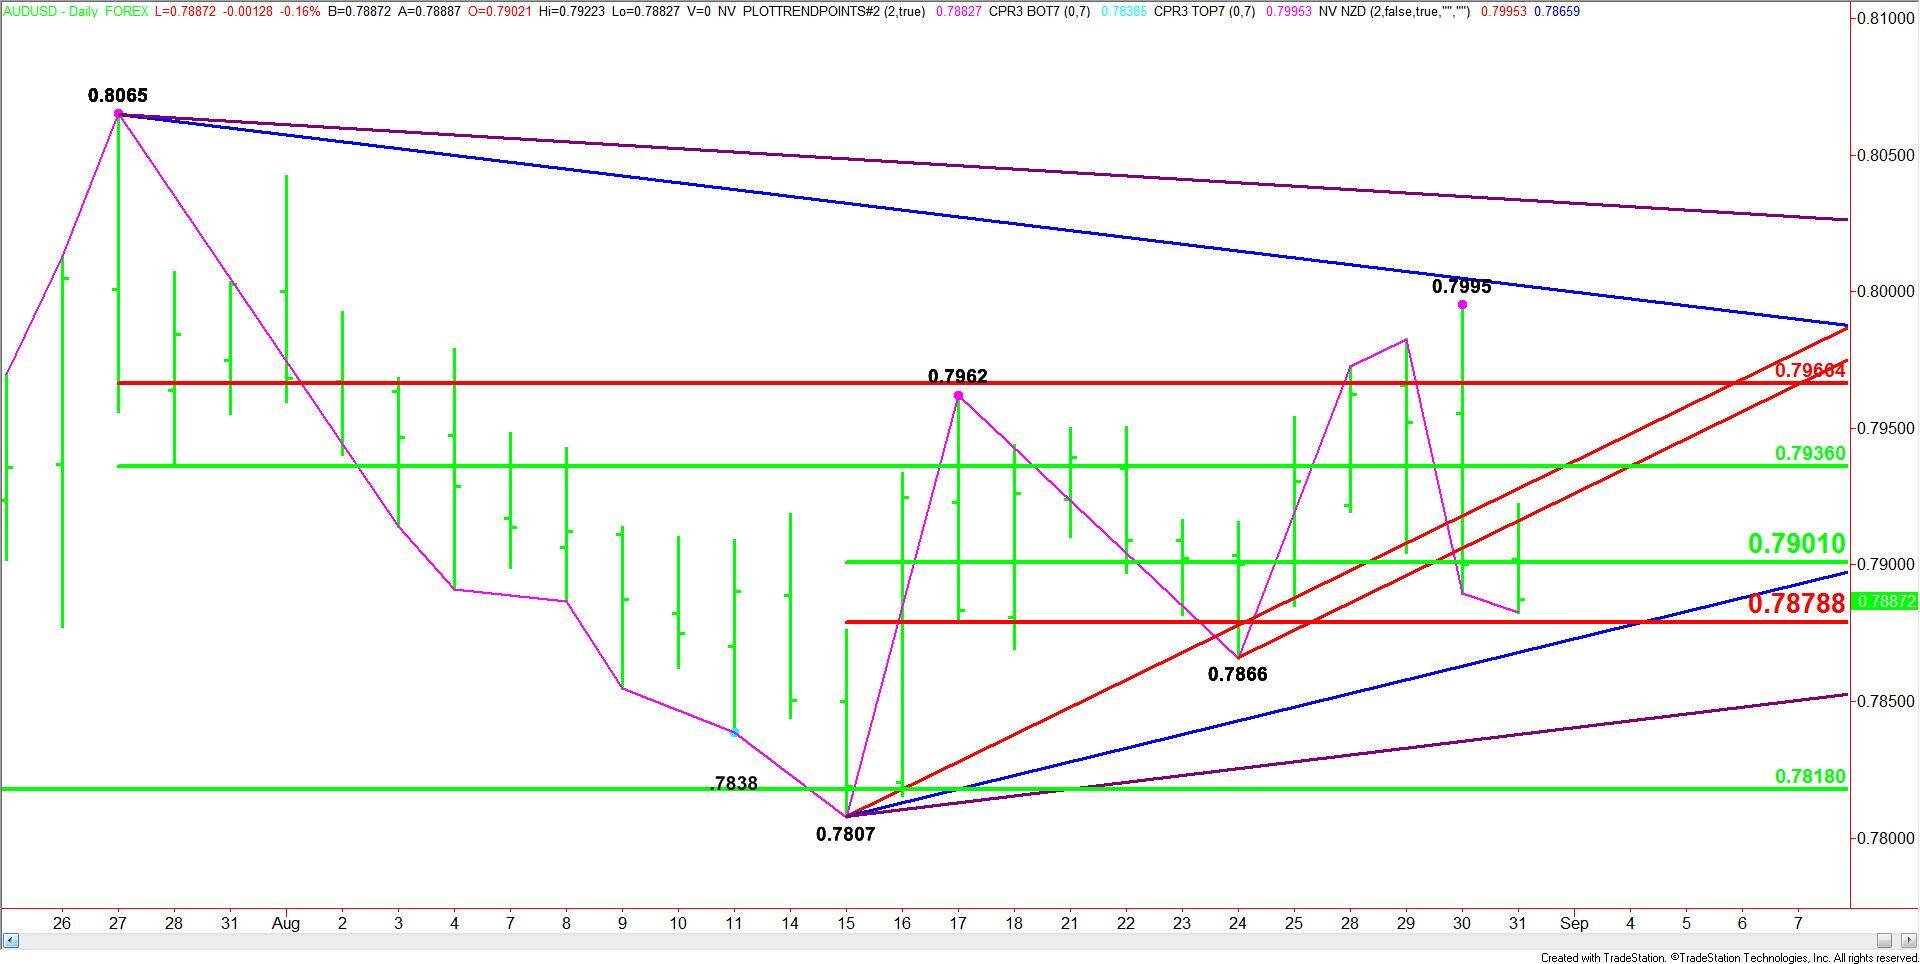
The main trend is up according to the daily swing chart, however, momentum may have shifted to the downside with the formation of a closing price reversal top at .7995 on Wednesday. Today’s price action confirmed this chart pattern when traders took out yesterday’s low.
A trade through .7866 will change the main trend to down. This could trigger an eventual move into the next main bottom at .7807.
The main range is .8065 to .7807. Its retracement zone is .7936 to .7968. This zone is new resistance.
The short-term range is .7807 to .7995. Its retracement zone at .7901 to .7879 is the first downside target. This zone is currently being tested.
Forecast
Based on the current price at .7884 (1117 GMT) and the earlier price action, the direction of the AUD/USD the rest of the session is likely to be determined by trader reaction to the Fibonacci level at .7879.
Taking out .7879 and sustaining the move will indicate the presence of sellers. This could trigger a quick break into a support cluster at .7867 to .7866. We could see a technical bounce on the first test of the price cluster.
However, if .7866 fails, the trend will change to down. This could trigger an acceleration into the next target angle at .7837. This is the last potential support angle before the major 50% level at .7818 and the main bottom at .7807.
Holding .7879 will indicate that buyers are coming in to defend the uptrend. This could trigger a rebound rally back to .7901.
Overcoming .7901 will signal that the buying is getting stronger with potential targets at .7916, .7927 and .7936.
Watch the price action and read the order flow at .7879 the rest of the session. Trader reaction to this level will tell us if the buying is getting stronger or if sellers are still in control.