


May Rally Rewrites Long-Term Trend
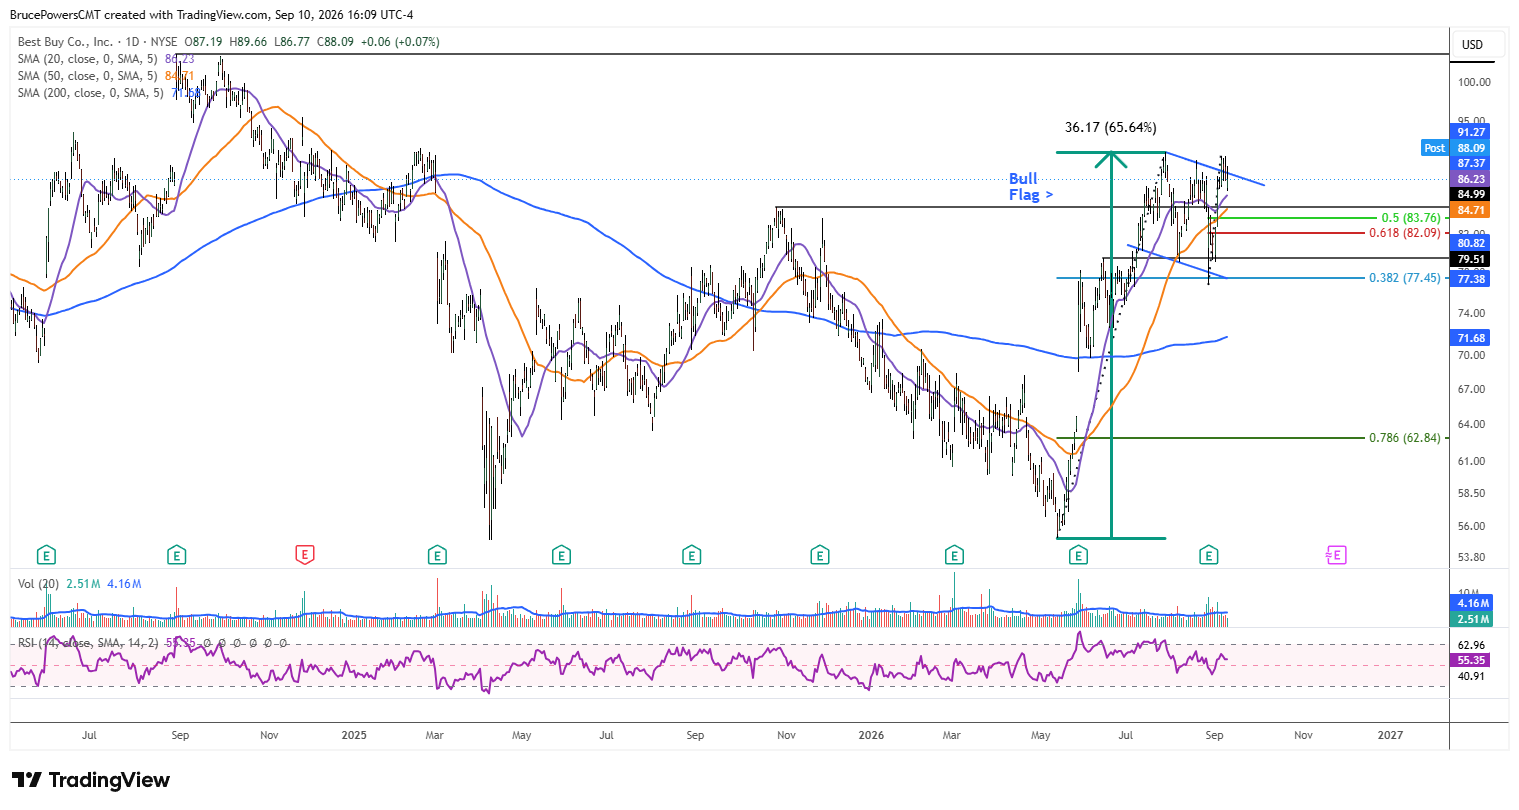
Following a second bottom at $55.10 in May the stock of Best Buy Co., Inc. (BBY) rallied to a high of
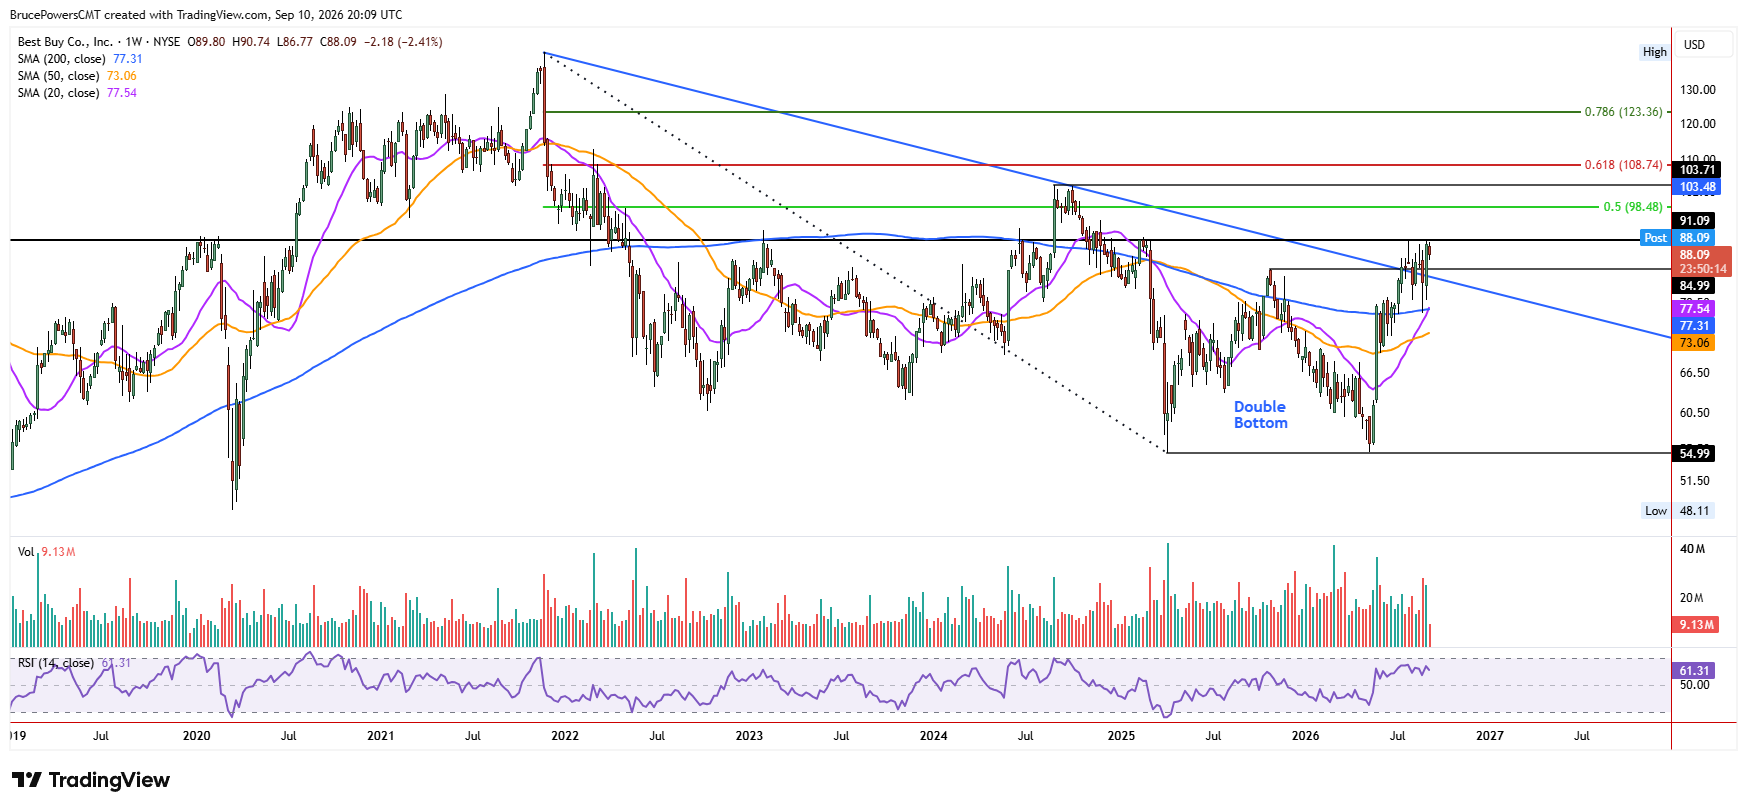
$91.27 by late-July, completing a 65.6% advance. The rally was supported by a positive response to its earnings report in late-May and confirmed strength by reclaiming the 200-day moving average and triggering a bullish reversal signal above the lower swing high of $84.99 from October 2025. The long-term downtrend line was also recovered.
Bullish Flag Breakout Gains Confirmation
A bearish correction followed the July high, which completed a 38.2% Fibonacci retracement of the prior advance and a higher swing low of $76.70. It has taken the form of a potential bullish flag. That new consolidation low was established on the day the company reported its Q2 fiscal year 2027 earnings. It was followed by a sharp advance that triggered a bullish reversal signal on a rally above the top boundary line of the flag and above the recent lower swing high at $90.26. A daily close above that high last Friday confirmed the signal, while reaching a high of $90.82.
Next Support Test Could Define Breakout
However, a short-term pullback has followed, and the breakout requires additional confirmation to increase the potential for success. The magnitude of the pullback and time to recovery will be key signals. Since the 50-day moving average was confirmed as dynamic support during the August pullback, it may mark support again. Currently, it is near $84.71 and rising and will soon converge with the October lower swing high, adding to the potential for that area to see support.
$91.27 Holds Key to Further Gains
A decisive advance above the recent high of $91.27 would signal a continuation of the May rally and further confirm the bullish reversal signal in July and the recovery of the long-term downtrend line. There is also a double bottom pattern that signaled a breakout during the May rally and it would also confirm on new highs.