Key Insights:
- On Tuesday, bitcoin (BTC) ended the day with a modest 0.72%, with support coming from a NASDAQ 100 rally.
- The upside came despite market angst over inflation, Fed monetary policy, and today’s Fed Chair Powell testimony.
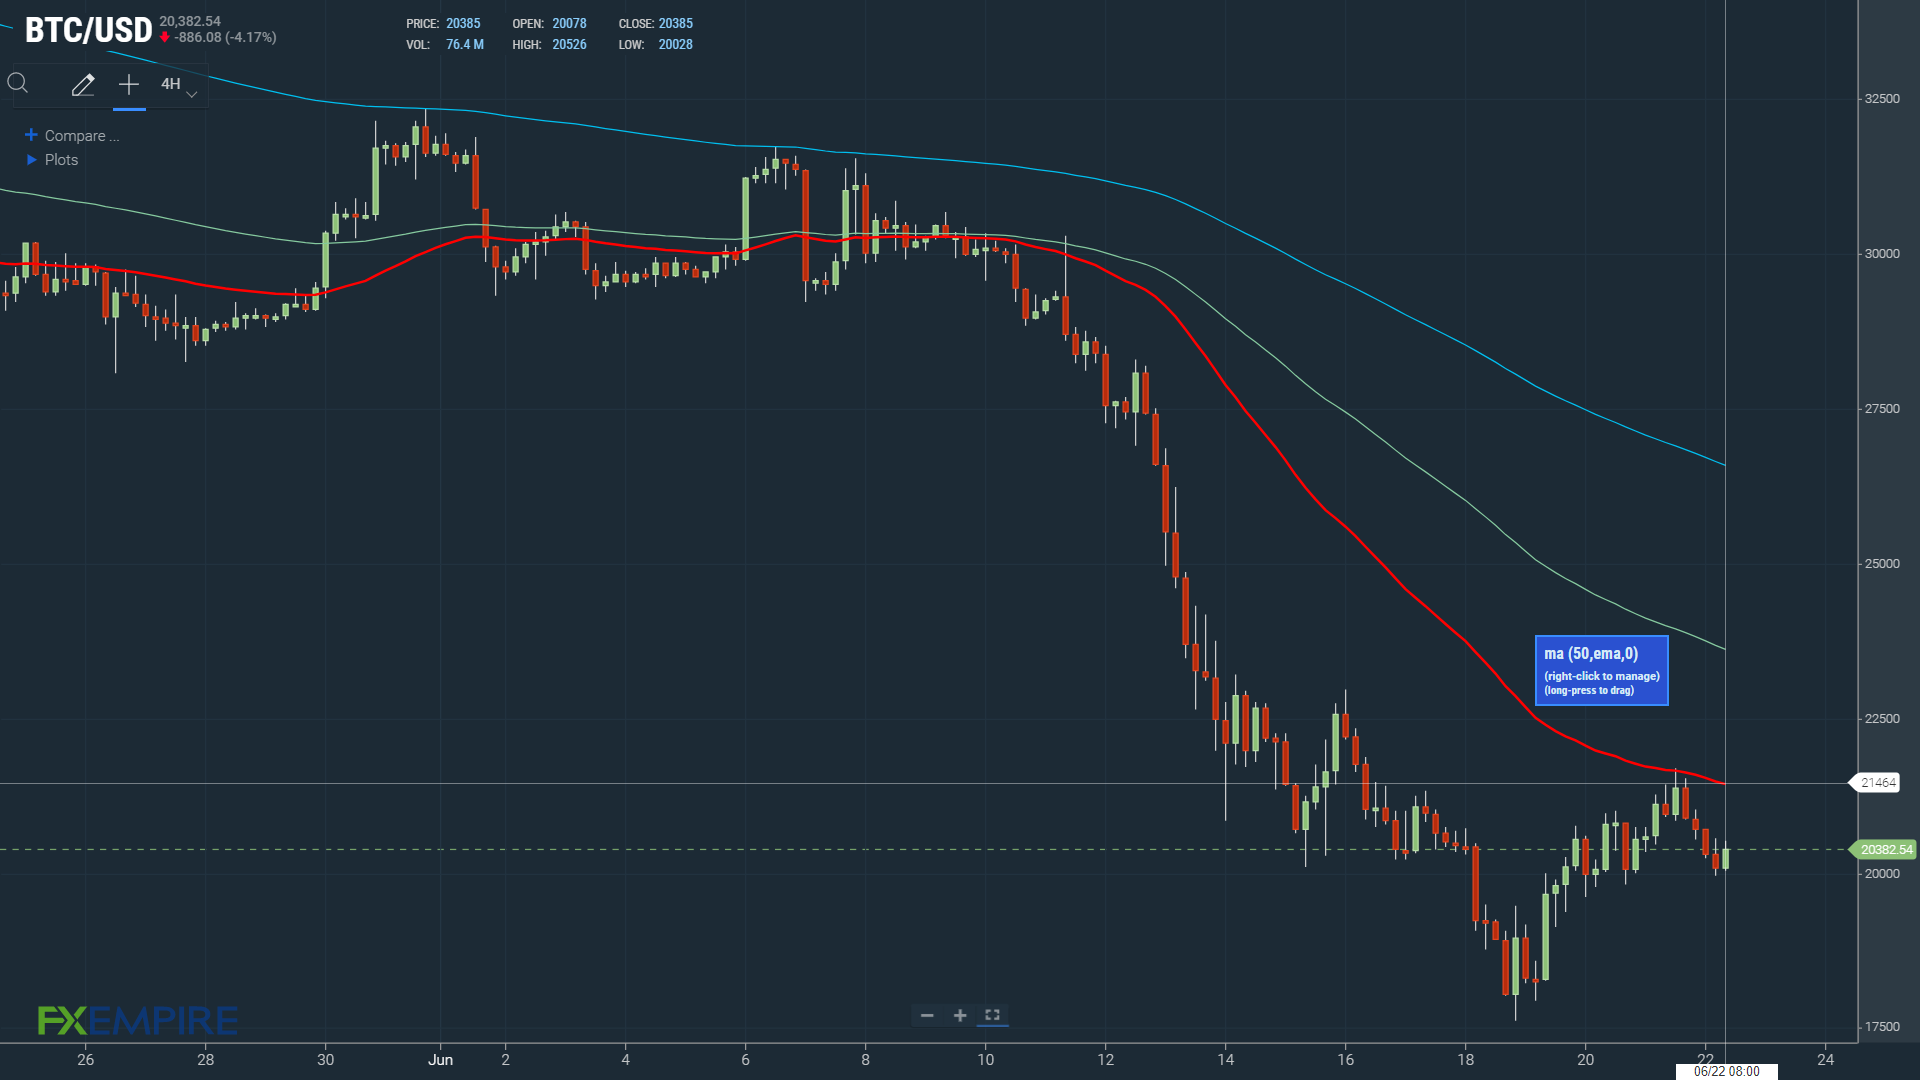
- Technical indicators are bearish, with bitcoin sitting below the 50-day EMA.
On Tuesday, bitcoin (BTC) rose by 0.72%. Following a 0.01% decline on Monday, bitcoin ended the day at $20,699.
A bearish start to the day saw bitcoin fall to a low of $20,339 before making a move.
Steering clear of the Major Support Levels, bitcoin rose to an afternoon high of $21,695.
Bitcoin broke through the First Major Resistance Level at $21,173 before falling back to sub-$21,000.
A bullish US equity market session provided support. However, a late pullback in the NASDAQ 100 left bitcoin with a modest gain.
On Tuesday, the NASDAQ 100 rallied by 2.51%.
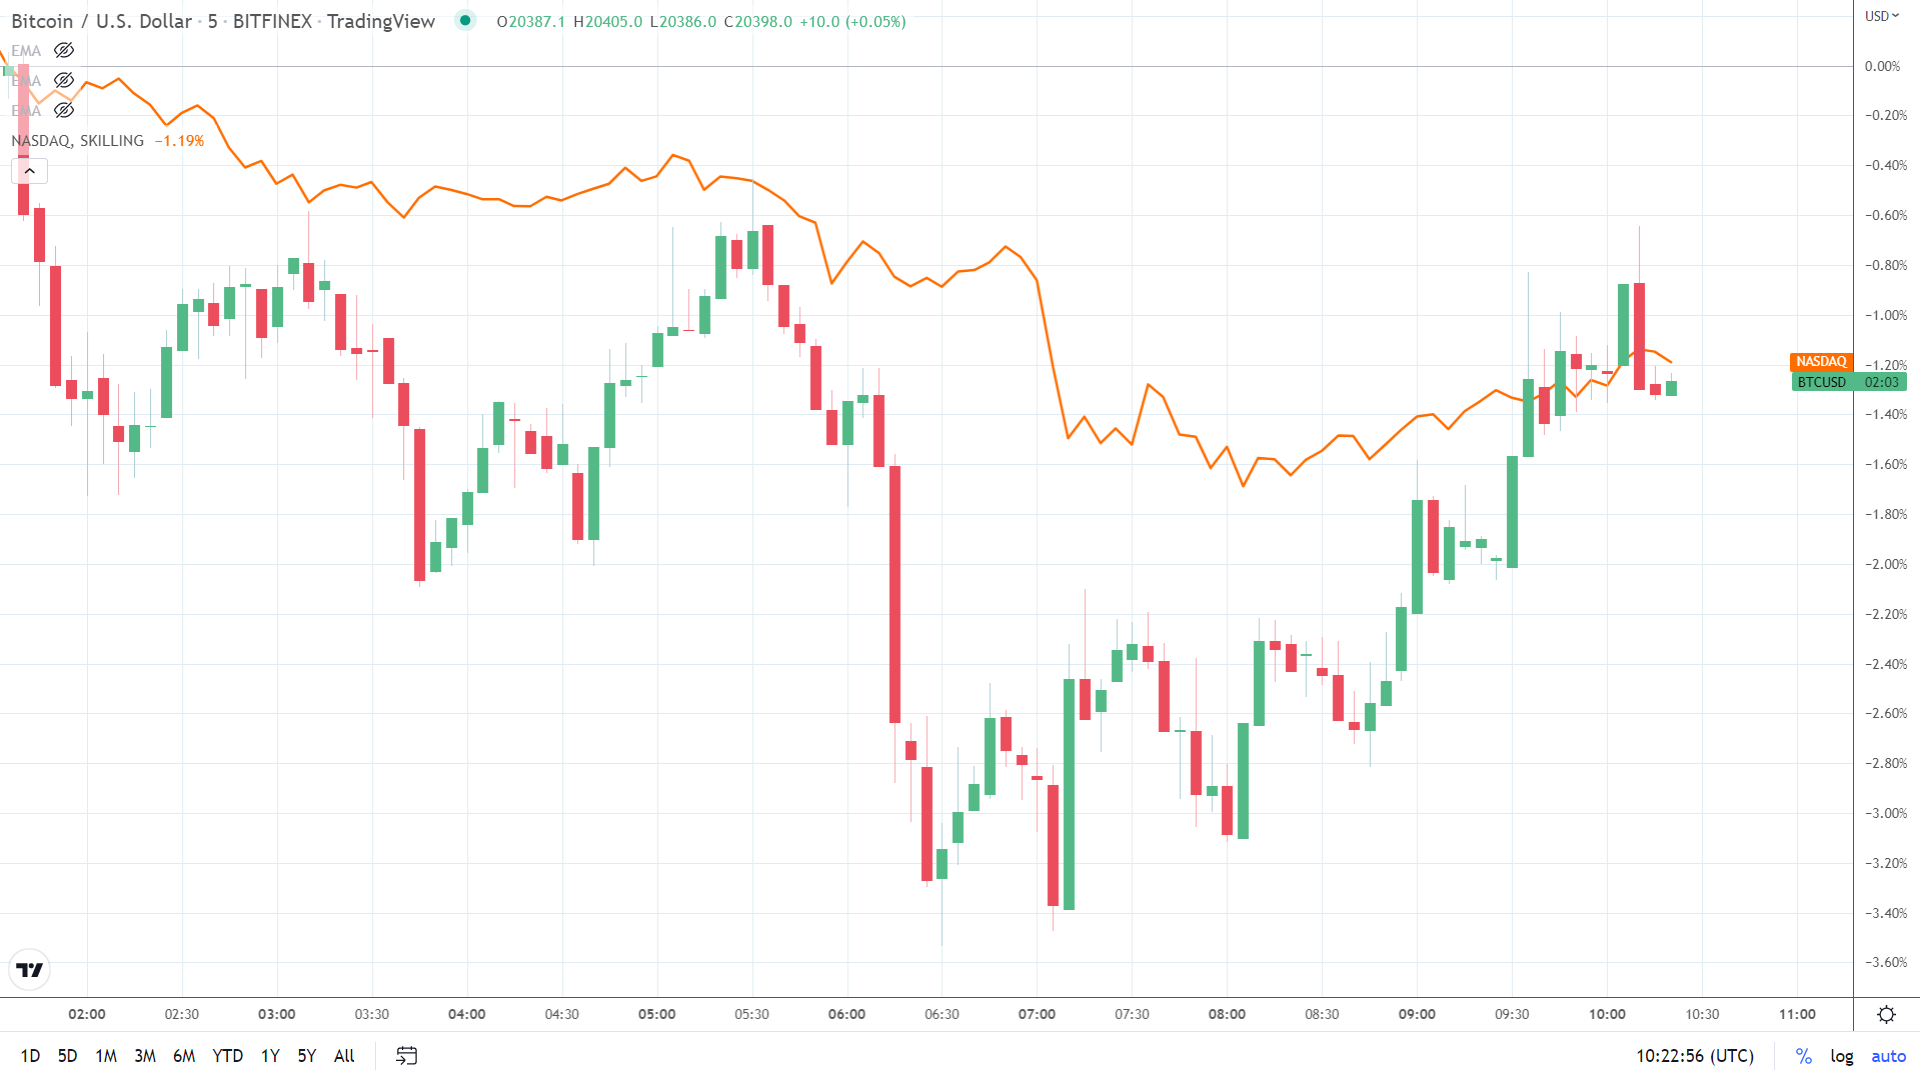
At the time of writing, the NASDAQ 100 Mini was down 182.5 points, with risk aversion sending WTI down 4.86% to $104.2. This morning, the bearish sentiment weighed on bitcoin and the broader crypto market, with the bitcoin correlation with the NASDAQ still in place.
Bitcoin tracked the NASDAQ 100 Mini into the red, with apprehension ahead of Fed Chair Powell’s testimony testing investor resilience.

Bitcoin Fear & Greed Index Sees Modest Rise
After holding steady at 9/100 on Tuesday, the Fear & Greed Index climbed to 11/100 this morning.
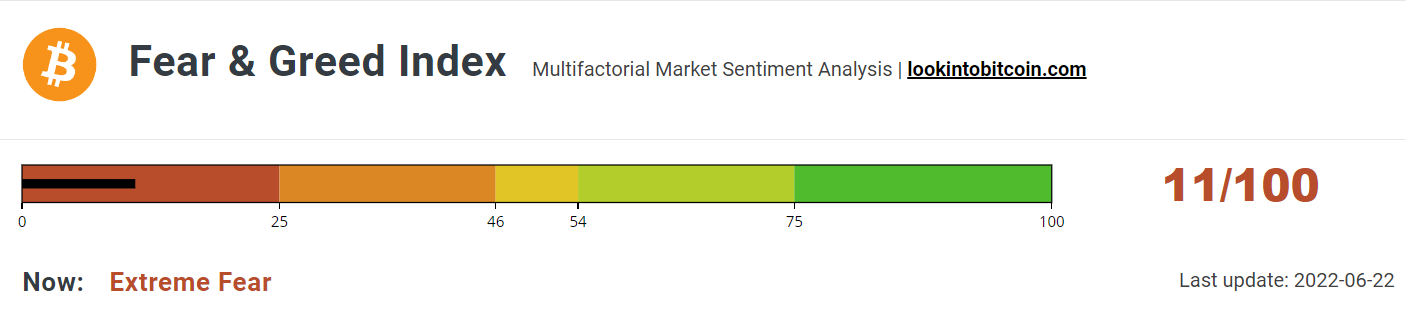
While it was the first time above 10/100 since June 13, the Index remained deep within the “Extreme Fear” zone, reflecting investor sentiment towards the crypto headwinds.
With Powell testimony on Capitol Hill in focus today, inflation, Fed monetary policy, and the US economy will be talking points.
The markets expect Fed Chair Powell to face stern questioning on the interest rate projections and how it plans to deliver a soft landing.
While the pre-scripted testimony will draw interest, the Q&A will likely have more influence. Suggestions of a hard landing and the need to rein in inflation at any cost could spook the markets.
Bitcoin Price Forecast
Every new Bitcoin analysis as it publishes, today's technical signal and key levels, live price — on one page.
See all Bitcoin forecastsBitcoin (BTC) Price Action
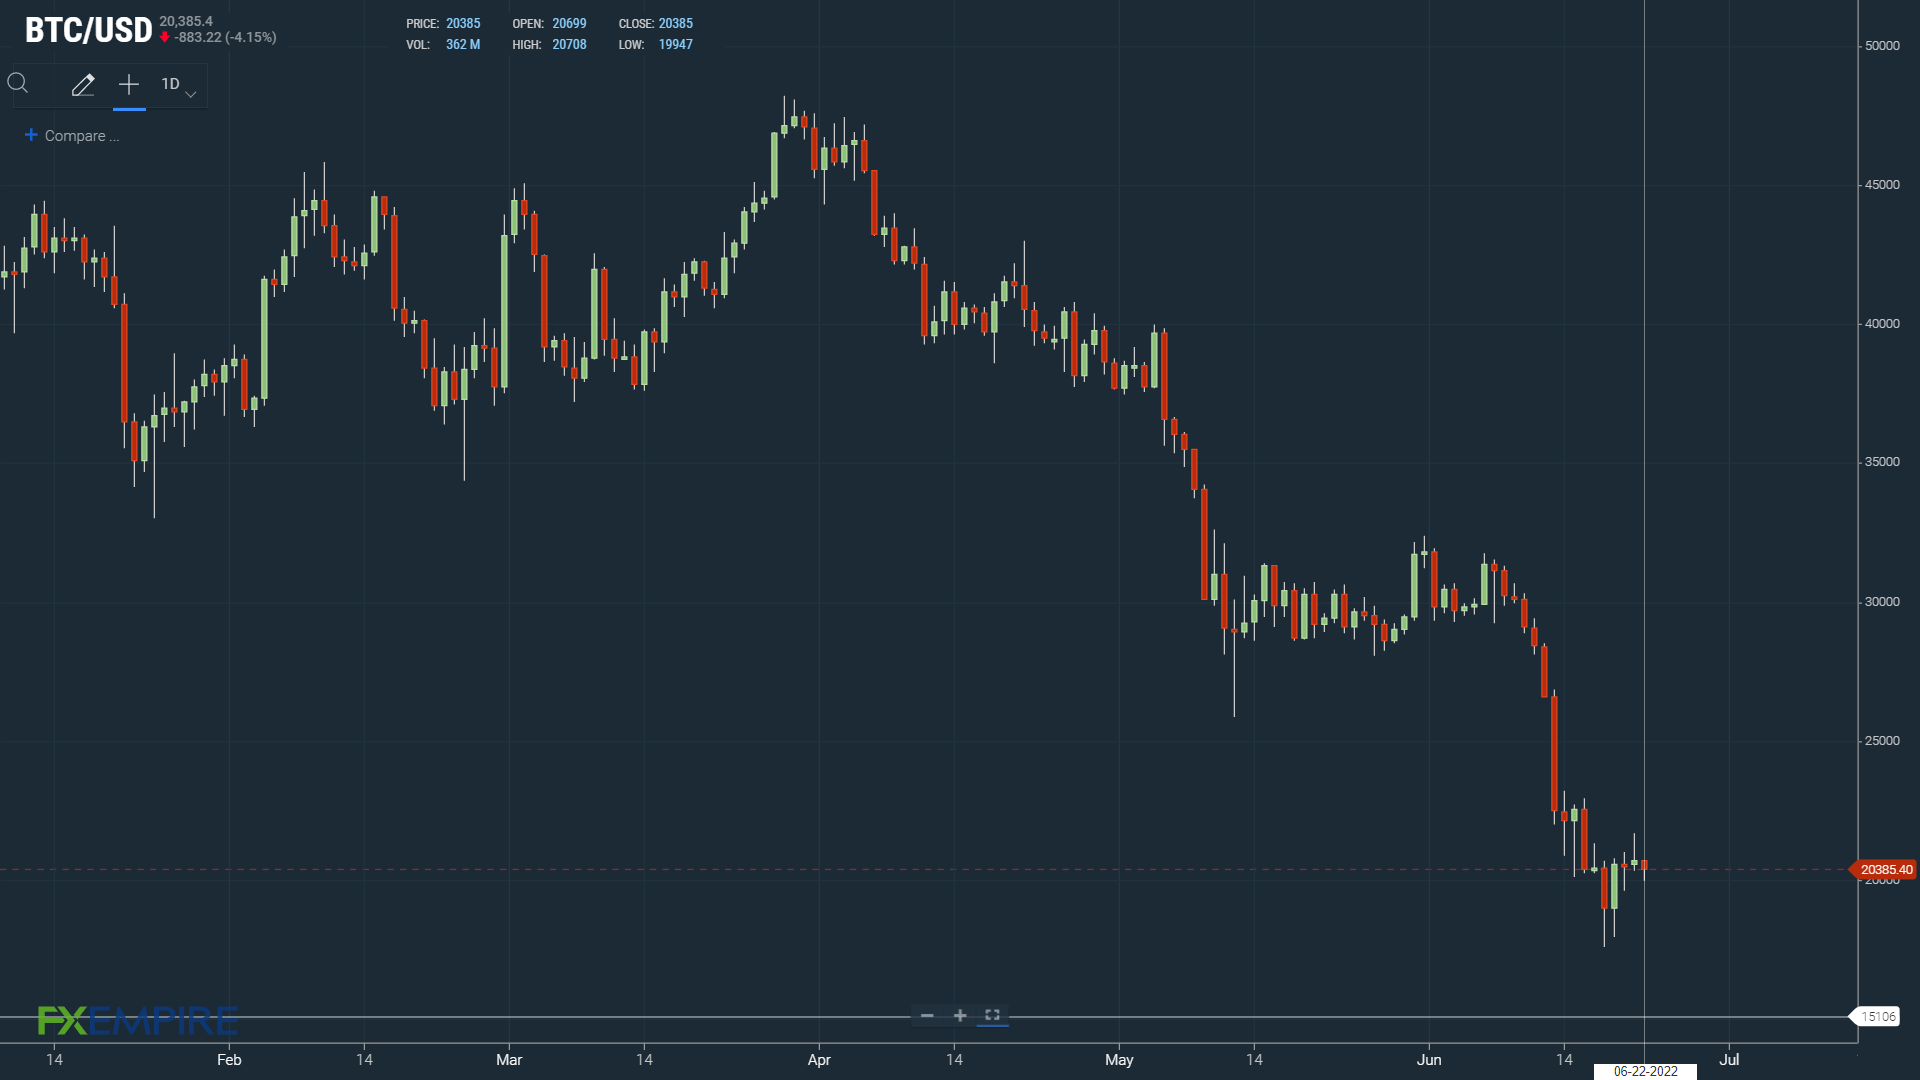
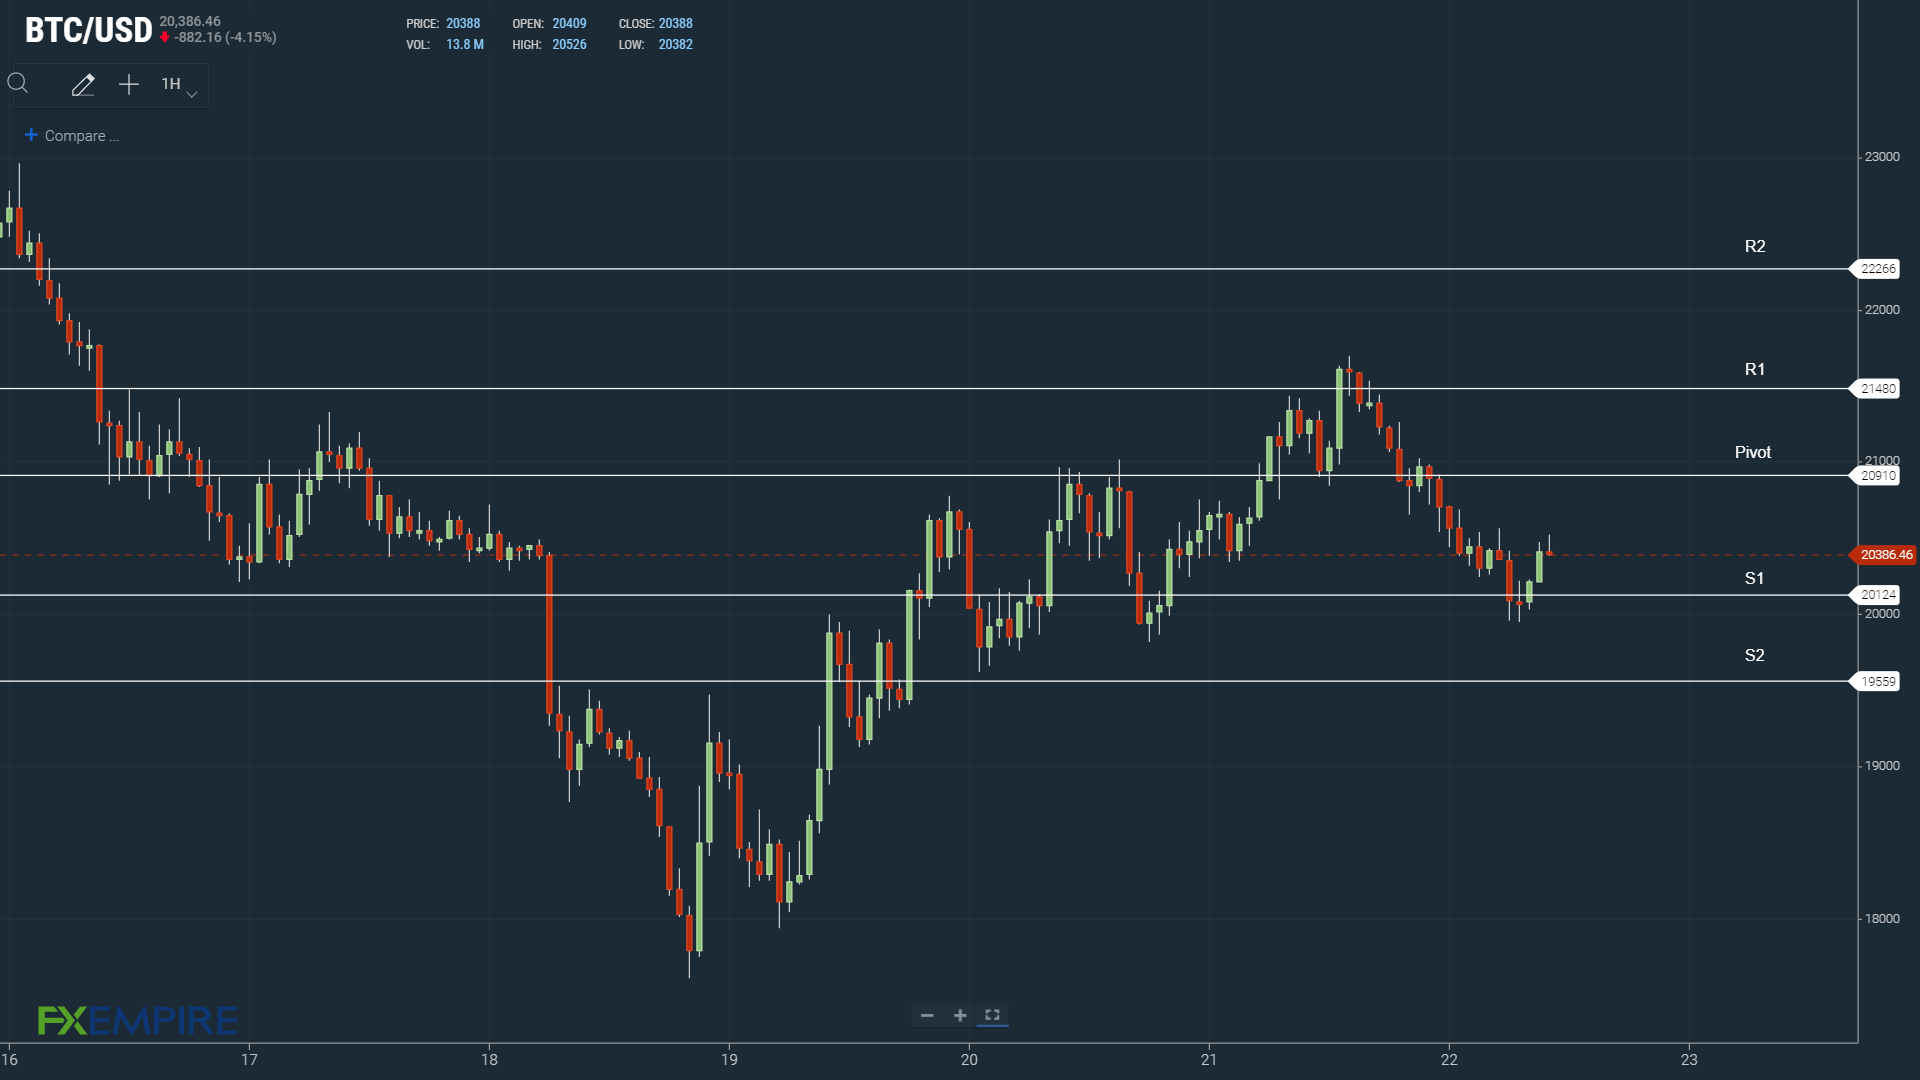
At the time of writing, BTC was down 1.52% to $20,385.
A bearish morning saw BTC fall to a low of $19,947.
BTC briefly fell through the First Major Support Level at $20,124 to test support at $20,000 before a partial recovery to $20,380 levels.
Technical Indicators
A move through the $20,910 pivot would bring the First Major Resistance Level at $21,480 and the Tuesday high of $21,695 into play.
BTC would need plenty of support for a return to $21,000.
An extended rally would test the Second Major Resistance Level at $22,266 and resistance at $22,500. The Third Major Resistance Level sits at $23,623.
Failure to move through the pivot would bring the First Major Support Level at $20,124 back into play. In the event of another extended sell-off, bitcoin could test the Second Major Support Level at $19,559 and support at $19,000.
The Third Major Support Level sits at $18,199.
Looking at the EMAs and the 4-hourly candlestick chart (below), it is a bearish signal. Bitcoin sits below the 50-day EMA, currently at $21,464. Today, the 50-day EMA fell back from the 100-day EMA. The 100-day EMA eased back from the 100-day EMA, bitcoin price negative.
The bitcoin pullback from the 50-day EMA on Tuesday brought $20,000 support back into play.
A move through the 50-day EMA would give the bulls a look at $22,500.