
Advertisement
Advertisement
Bitcoin Moves from 10k to 15k and Shows No Signs of Stopping
By:
Bitcoin is showing a massive bullish breakout and continuation. The cryptocurrency is approaching a critical 78.6% Fibonacci retracement level. What’s next?

Bitcoin (BTC/USD) is showing a massive bullish breakout and continuation. The cryptocurrency is now approaching a critical 78.6% Fibonacci retracement level. What’s next?
This article will review the key Elliott Wave patterns. We will also analyse the most likely expected price path of least resistance.
Price Charts and Technical Analysis
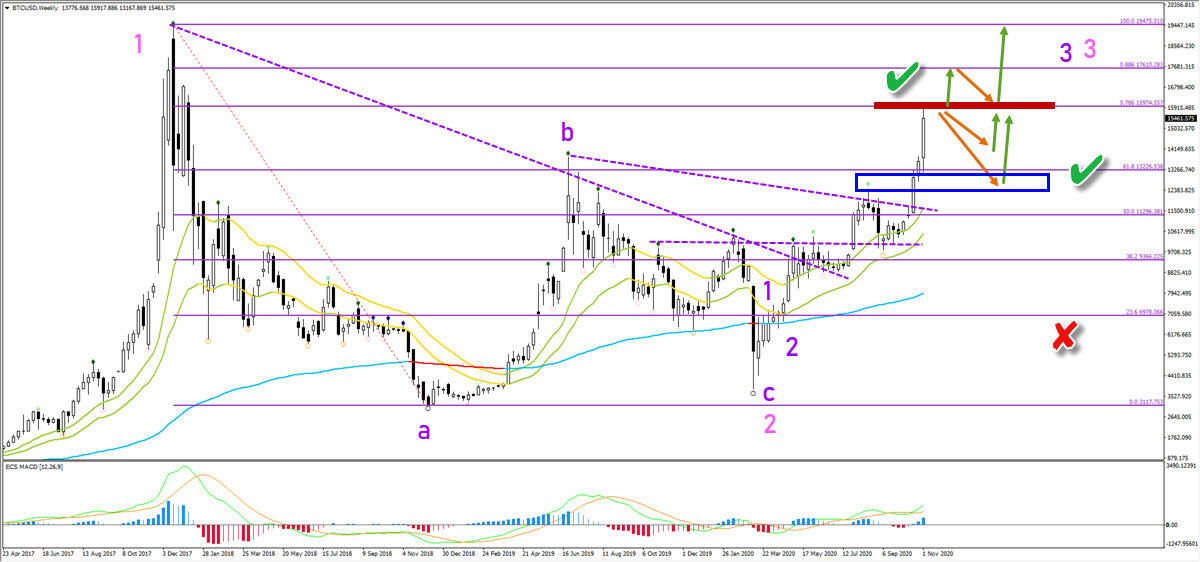
The BTC/USD made a strong bullish breakout above the 21 ema zone and the resistance trend lines (dotted purple). Ever since the break, price action has remained consistently above the 21 ema zone without any threat of pushing below it.
The bullish bounce at the 21 ema zone catapulted price action higher and above the 50-61.8% Fib zone. Now price action is closing in on the deeper 78.6% Fibonacci level.
A bearish reaction at this deep Fibonacci level is expected. A small bull flag chart pattern is expected to emerge. Any shallow or medium retracement should find support for a bounce. An uptrend continuation seems just a question of when and where: either an immediate breakout or after a pullback.
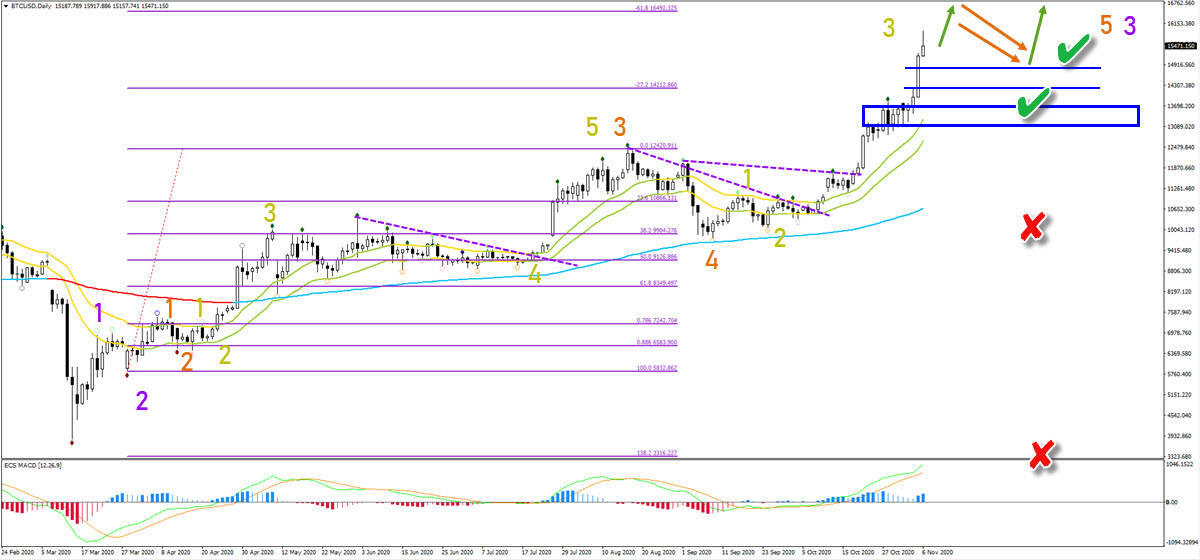
On the daily chart, price action has been breaking above the resistance and staying above the 21 ema zone. The shallow retracements turned out to be typical wave 4 patterns.
The current impulse is very strong. Price action has clearly pulled away from the 21 ema zone. This is indicating a wave 3 (green) and more upside to be expected either immediately or after the pullback within the wave 4.
Even after wave 4 (green) is completed, more upside is expected because of wave 3 on a higher degree (purple). Simply said, BTC/USD seems to be – finally – in a massive wave 3. Time will tell if price action has finally reached this important impulsive phase.
Good trading,
Chris Svorcik
The analysis has been done with the indicators and template from the SWAT method (simple wave analysis and trading). For more daily technical and wave analysis and updates, sign-up to our newsletter
For a look at all of today’s economic events, check out our economic calendar.
About the Author
Chris Svorcikcontributor
Chris Svorcik is co-founder, trader, and analyst with Elite CurrenSea (www.EliteCurrenSea.com) since 2014.


Advertisement