



The US stock market rebounds higher on Tuesday after the sharp selloff last week. Bitcoin price also gained 1.34% on Tuesday as the recovery in the US stock market suggests that the appetite for risk is improving and supporting the Bitcoin (BTC) market.
The latest ETF figures also supported the fresh demand. US spot Bitcoin ETFs attracted about $23.2 million in net inflows on Tuesday. BlackRock’s IBIT led with $29.9 million while withdrawals from Bitwise partly offset the buying. These inflows provide support but sustained buying would make the recovery more convincing.
The correction in the US dollar also supports the Bitcoin market. The US dollar index consolidates near three-week low on Wednesday as demand for the currency eased. But Brent crude oil rallied back above $110 as the market assessed the continued threats to supplies in the Middle East.
The high cost of energy could keep inflation elevated and make the Fed reluctant to ease monetary policy. That would keep the cost of borrowing high and could restrain demand for cryptocurrencies. In my view, the recovery in Bitcoin remains vulnerable to another increase in oil prices and Treasury yields.
Bitcoin Price Forecast: $87,200 Breakout Could Open the Way to $100,000
The daily chart for Bitcoin shows that the price has produced a low at the support of the ascending broadening wedge pattern in the $50,000 to $60,000 zone in July. After strong consolidation in June and July, Bitcoin prices surged in August and September to break above $80,000.
The emergence of ascending broadening wedge patterns since 2022 suggests that prices are highly volatile. The bottom formation process in June and July suggests that prices remain in a strong trend. Now, Bitcoin prices have found strong support in the $80,000 to $82,000 area. This is seen as strong support in the Bitcoin market in the short term, and prices are again rebounding higher.
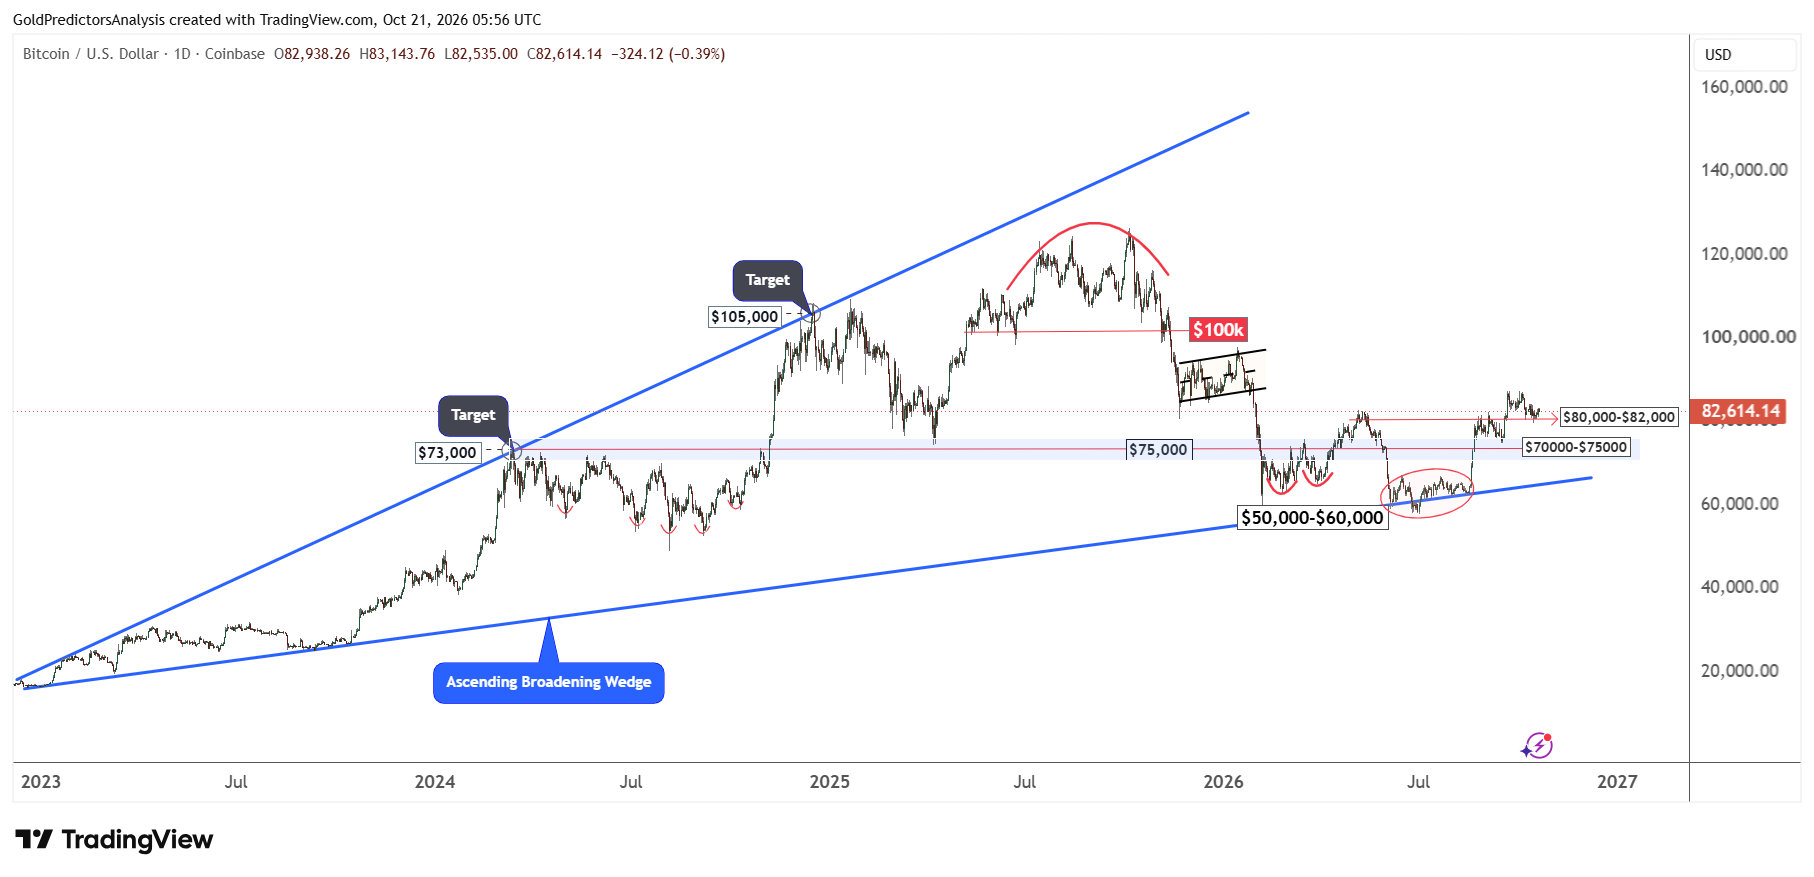
A break above $87,200 will likely open the way for Bitcoin prices towards the $100,000 area. On the other hand, a confirmed break below $80,000 will open the way for a further drop towards the $70,000 to $75,000 region. As long as prices remain above the $80,000 area, the possibility of a strong rally to the upside is high.
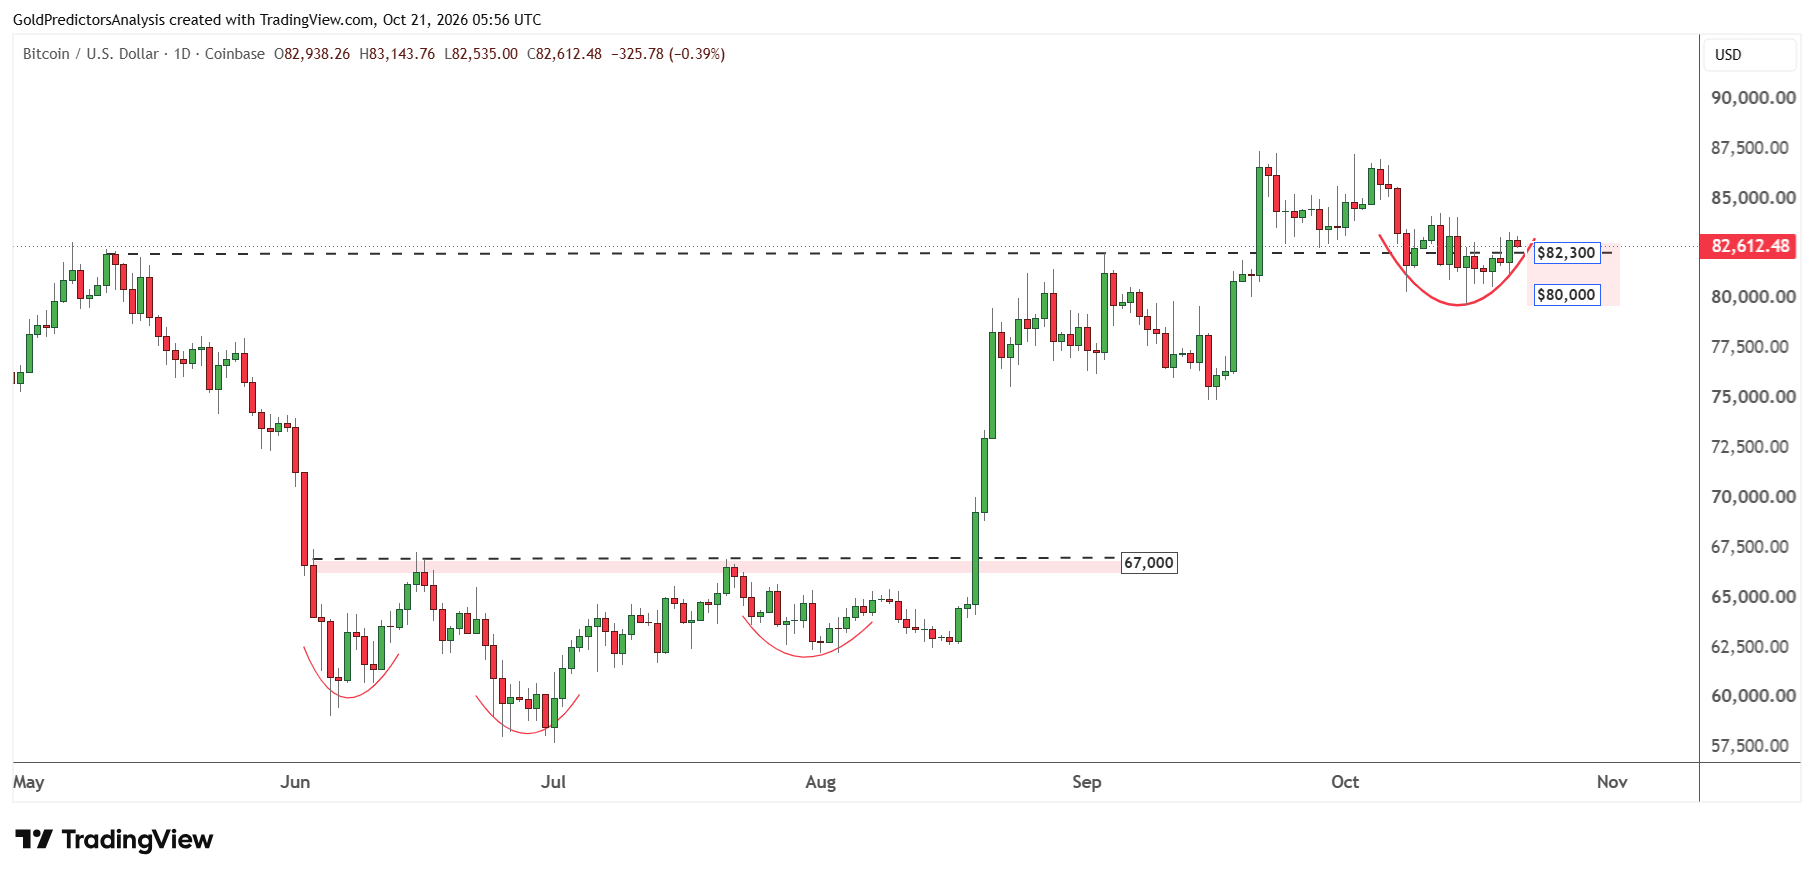
The short-term price compression in June and July is also observed on the daily chart below. The price is consolidating between $80,000 and $82,000 during the first two weeks of October and showing constructive price action. If the price recovers above $84,000, it will likely open the way for rally towards the $87,000 region. However, a break above $87,000 is required to push the price to the $100,000 area.
Bitcoin Price Forecast
Every new Bitcoin analysis as it publishes, today's technical signal and key levels, live price — on one page.
See all Bitcoin forecastsBitcoin vs Gold and Silver: Falling Ratios Signal Relative Strength
The ratio of precious metals to Bitcoin provides an indication of relative strength in the Bitcoin market in the short term. The chart below shows that the gold-to-Bitcoin ratio produced a low in December 2024 and rebounded to reach a high in February 2026 in the 0.08 region.
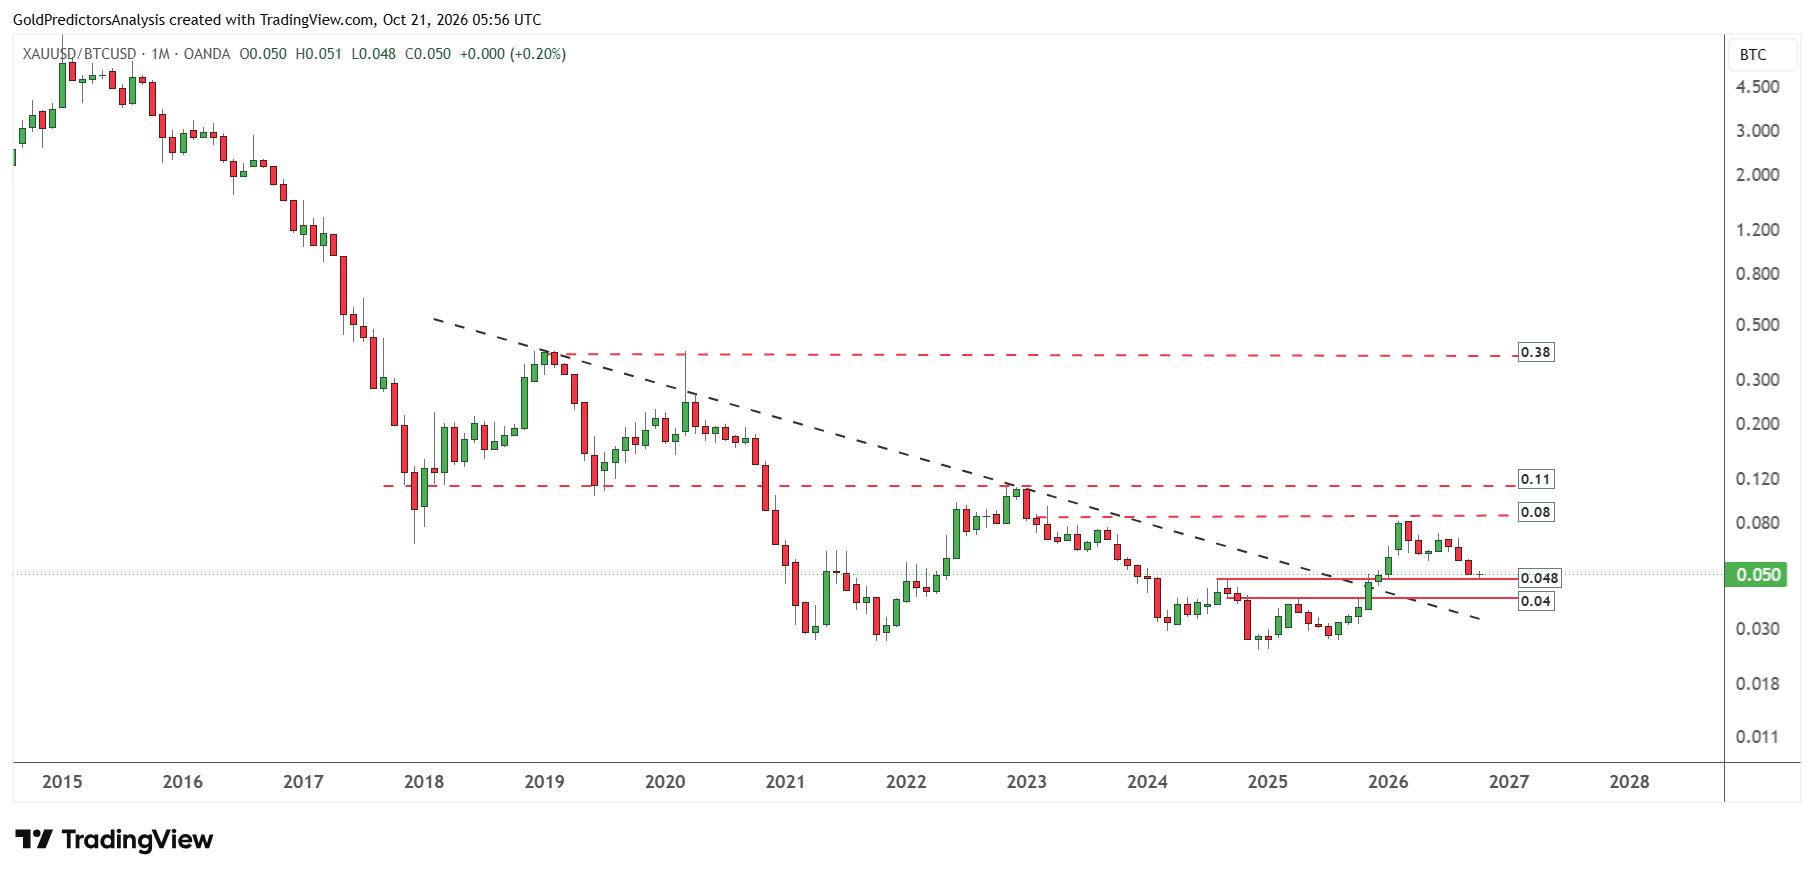
After marking this high, the ratio continues to drop towards the key support level of 0.048. The drop in the ratio since February 2026 suggests that Bitcoin is outperforming gold in 2026. If the ratio breaks below 0.048, it may move towards 0.04, which will likely increase the possibility of upside move in Bitcoin.
A break below 0.04 will strengthen the outlook for Bitcoin. On the other hand, if the ratio produces a low between the 0.04 and 0.0048 levels and rebounds higher towards the 0.08 level, it may limit the rally in the Bitcoin market and keep prices consolidating.
The silver-to-Bitcoin ratio shows similar price action. The chart below shows that the ratio produced a low in December 2024 and rebounded higher towards the 0.00145 level in February 2026. After marking this high, the ratio is correcting towards 0.00054, which is considered strong support for the ratio. If the ratio finds support at 0.00054, it may confirm a bottom in silver prices.
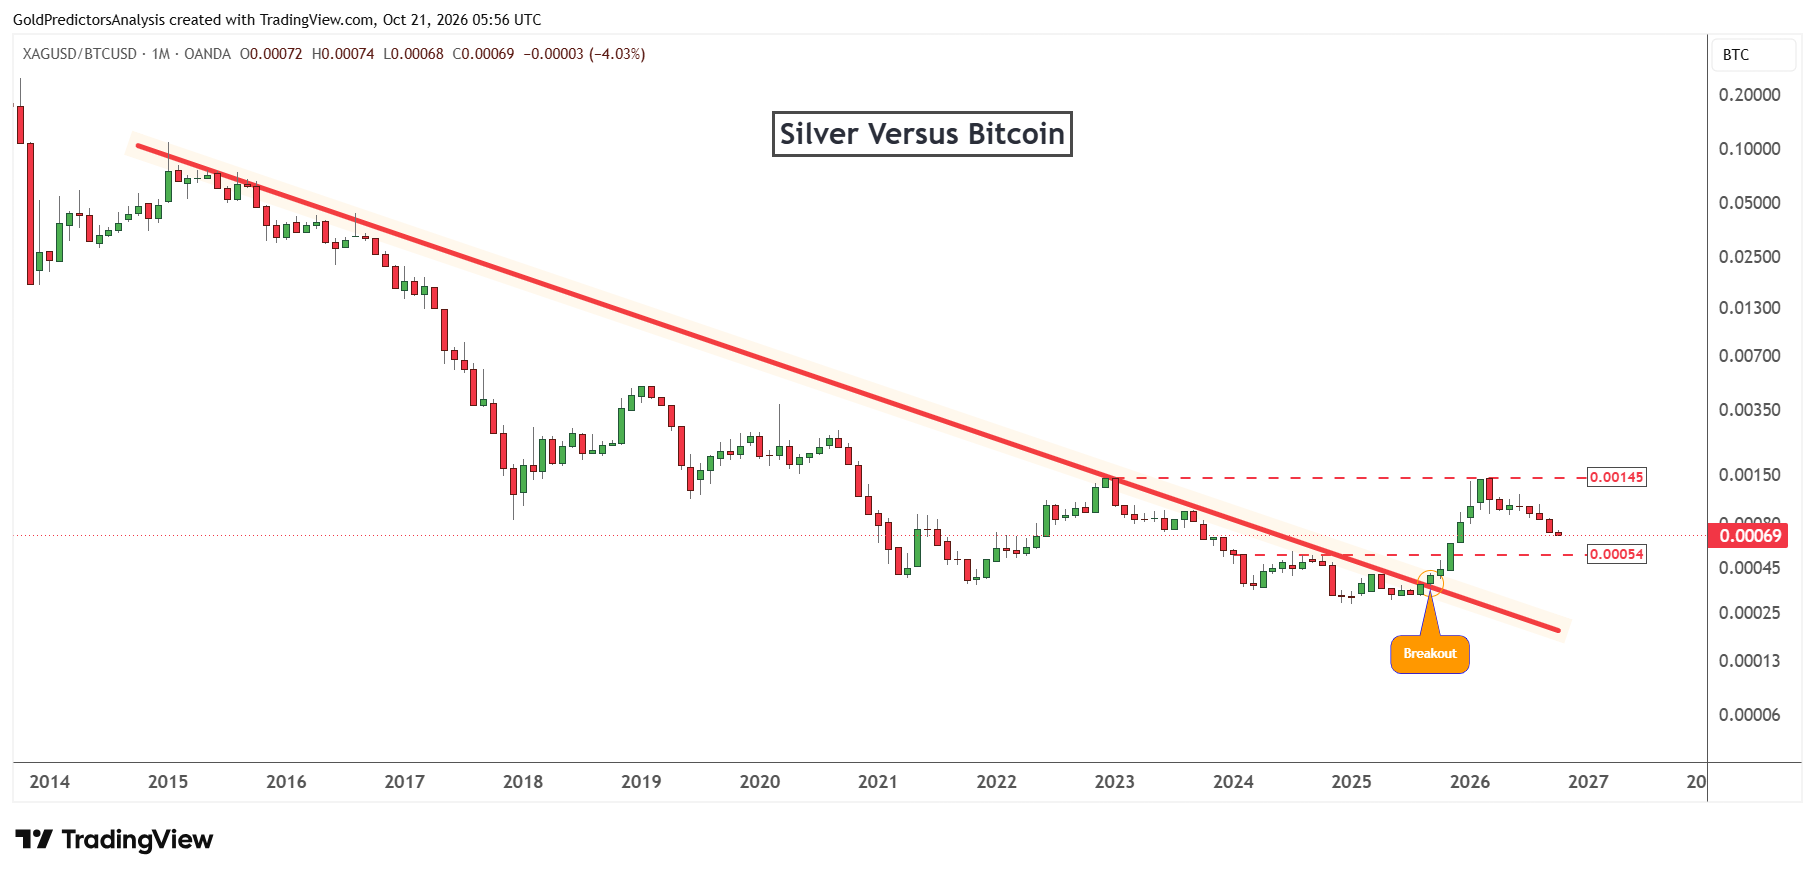
As the ratio has been dropping from the resistance area and has continued to show bearish pressure during the past three months, it suggests that Bitcoin prices may continue to remain strong in the near term.
What to Watch Next
The recovery in Bitcoin receives support from the improvement in appetite for risk, fresh ETF inflows and a weak US dollar. The continued weakness in gold-to-Bitcoin and silver-to-Bitcoin ratios also suggests that Bitcoin shows relative strength. In my view, the $80,000 and $82,000 remain important support levels for Bitcoin in the short term. A confirmed break above $87,200 could open the way to $100,000. But the increase in oil prices could fuel inflation and keep the cost of borrowing high. This limits demand for cryptocurrencies. A break below $80,000 would increase the risk of deeper correction to $70,000 to $75,000.