
Gold (XAU) trades near $4,160 an ounce on Wednesday, while Bitcoin (BTC) has recovered to around $83,650 after a sharp selloff. The tensions in the Middle East, rising debt concerns and fresh Bitcoin ETF flows shape the debate between the two assets. In my view, gold prices remain under pressure in the short term due to the higher interest rate environment despite the safe-haven demand. Meanwhile, Bitcoin needs steady demand to sustain the recovery above $80,000.

Gold vs Bitcoin: War Risks and ETF Flows Shape the Outlook
The escalation in tensions in the Middle East keeps the defensive role of gold in focus. As per the latest development, two vessels were struck in the Strait of Hormuz. Saudi authorities also reported a limited fire after an attack on Aramco administrative building.
Brent crude traded near $109 a barrel in early Asian trading on Wednesday. Further disruption could increase demand for gold as a safe haven. But higher oil prices can also keep the risk of inflation elevated and support higher interest rates. This could limit the gains in gold and weaken demand for riskier assets such as Bitcoin.
The IMF added another warning by highlighting the risk from growing public debt, rising bond yields and a possible correction in AI investments. The stress in bonds and stocks can spread across financial markets.
In my view, gold may attract demand as a defensive asset if confidence drops. The limited supply of Bitcoin supports its role as store of value, but it does not prevent short-term selling. New York Fed President John Williams also said that another increase in interest rates may be needed this year. The high rates remain a challenge for both assets.
The latest correction in Bitcoin on Monday was due to liquidations. But the ETF demand showed early signs of recovery. Farside reported $65.4 million in net US Bitcoin ETF outflows on Monday. The preliminary Tuesday data showed $103.1 million entering Fidelity’s fund while results from BlackRock remained unreported. The price has rebounded strongly on Tuesday. The sustained inflows could further support the rebound on Wednesday from the key support.
Gold Price Forecast
Every new Gold analysis as it publishes, today's technical signal and key levels, live price — on one page.
See all Gold forecastsBitcoin-to-Gold Ratio: Recovery Near 20 Faces a Bigger Test
These competing drivers make relative performance important for both assets. The weekly chart below shows the ratio of Bitcoin to gold is recovering toward 20 after finding support near 13 earlier this year.
The increase in the ratio suggests that Bitcoin is outperforming gold. The rounded bases near 13 and 14 suggest that the selling pressure has eased. But this measures the performance between the two assets.
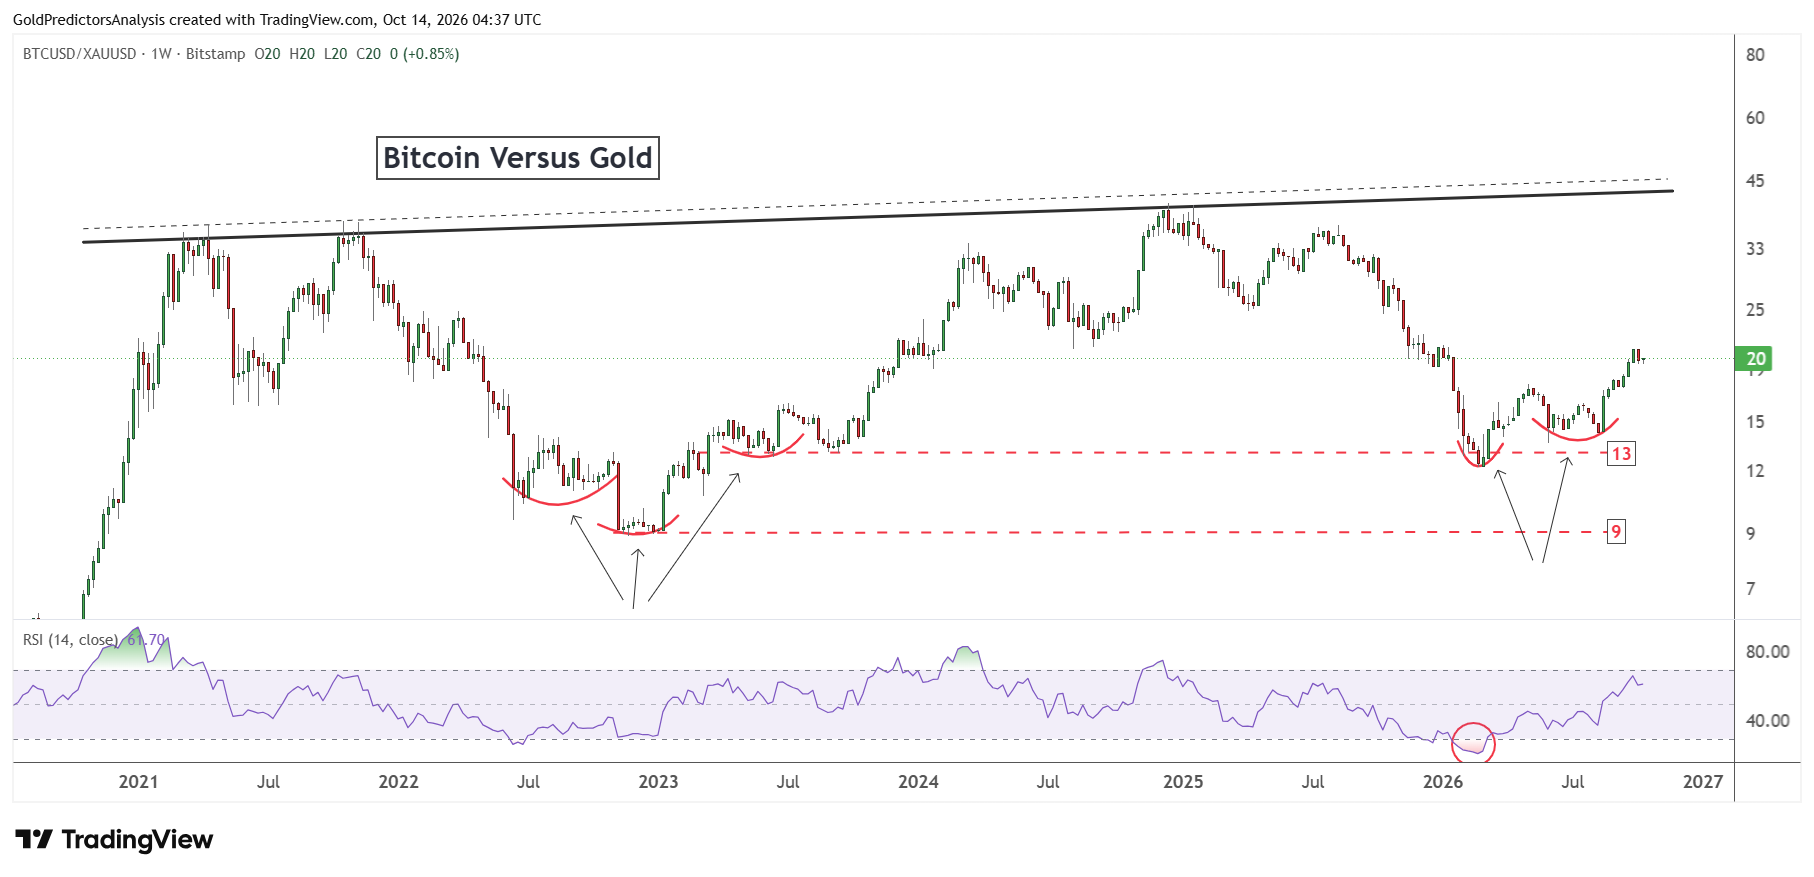
The weekly RSI has recovered to about 61. The RSI stands above the midpoint and below the overbought threshold. This supports the improvement in the relative momentum of Bitcoin.
However, the ratio still needs a clear break above the 21 area to support a positive trend in Bitcoin. A clear break above this level could push the ratio to the first target of 25. A break above 25 may push the ratio to the key resistance at 35.
A rejection at the 21 level would leave room for another pullback in the ratio. The key support level for the ratio is 13. A break below this level would indicate a drop to near 9 and signal renewed weakness in Bitcoin.
The monthly chart below also shows that the rebound in the ratio needs confirmation. The ratio broke below the rising boundary of the former ascending triangle in late 2025. The recovery from 13 has not yet reclaimed that trendline. The upper boundary near 40 also remains far above the current level.
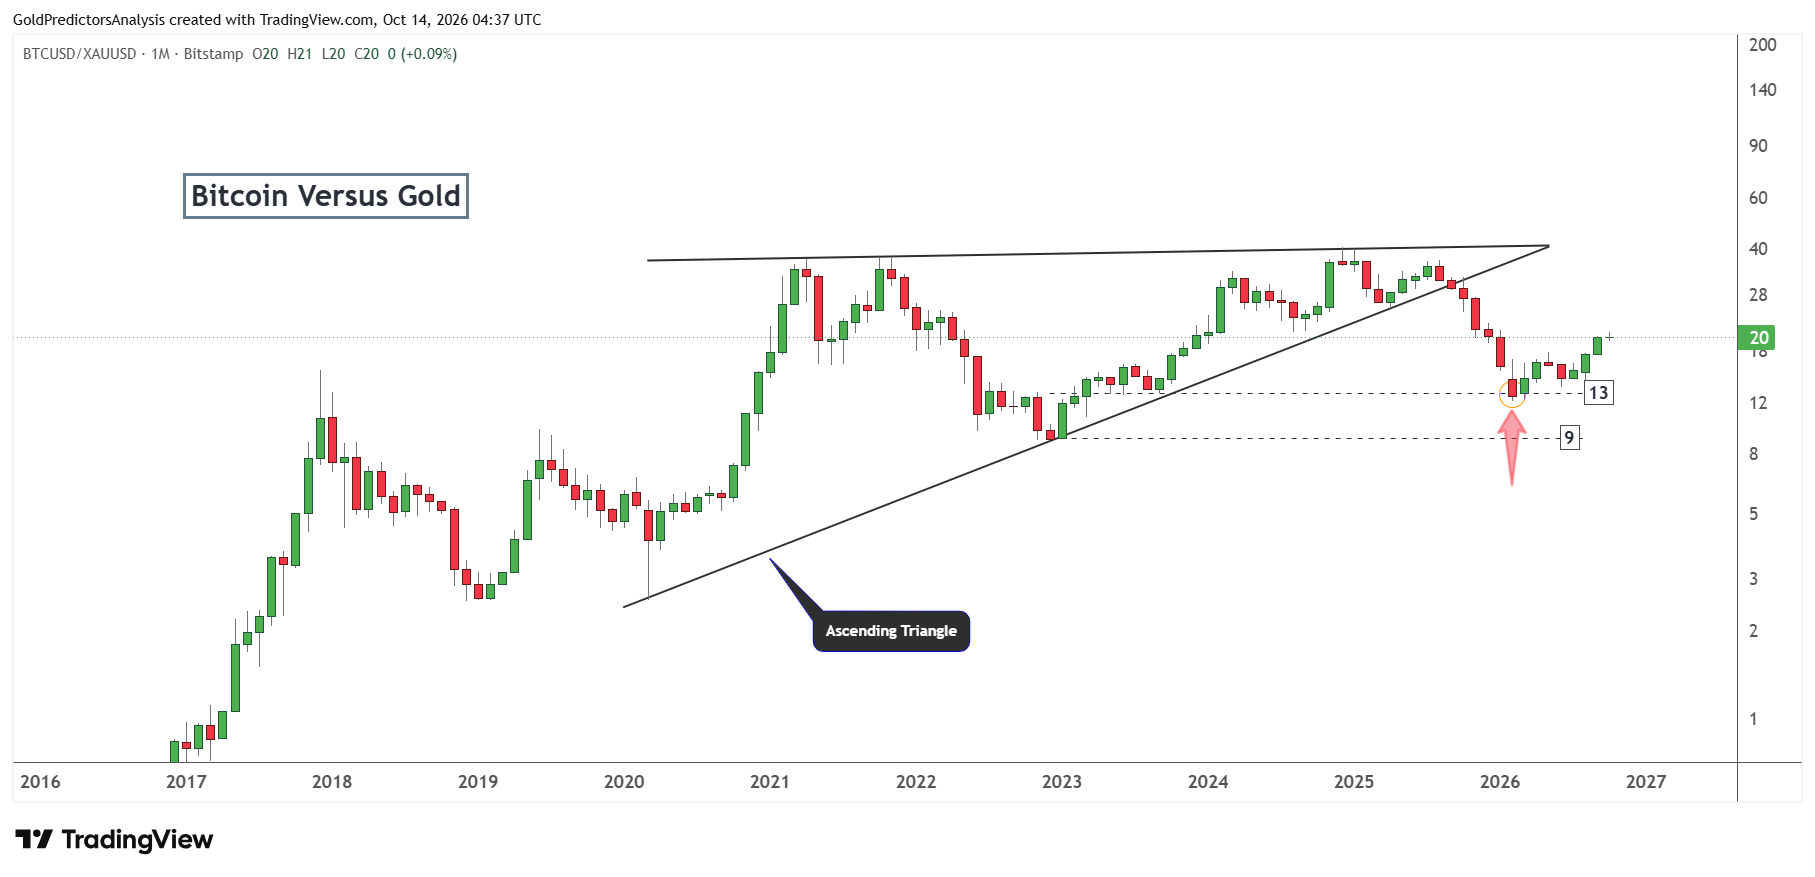
In my view, Bitcoin has improved its position against gold, but the larger structure remains unresolved. The ratio must break the recent highs near 40 to suggest bullish momentum. The continued ETF demand could help extend the recovery but the renewed financial stress could favour gold.
Bitcoin Price Forecast: $87,400 Breakout Could Target $98,000
The weekly chart for Bitcoin shows that the price has produced constructive price action above 60,000 and produced a strong rally to break above 82,300. After the breakout from 82,300, the price corrected lower last week to reach a low at 80,314 and closed the week above 82,300. This suggests positive price action in the short term and increases the possibility of consolidation.
A break above 87,400 will likely introduce a strong rally towards the 97,000-98,000 area in the short term. But a break below the 80,000 zone will offer further downside towards the 75,000 area.
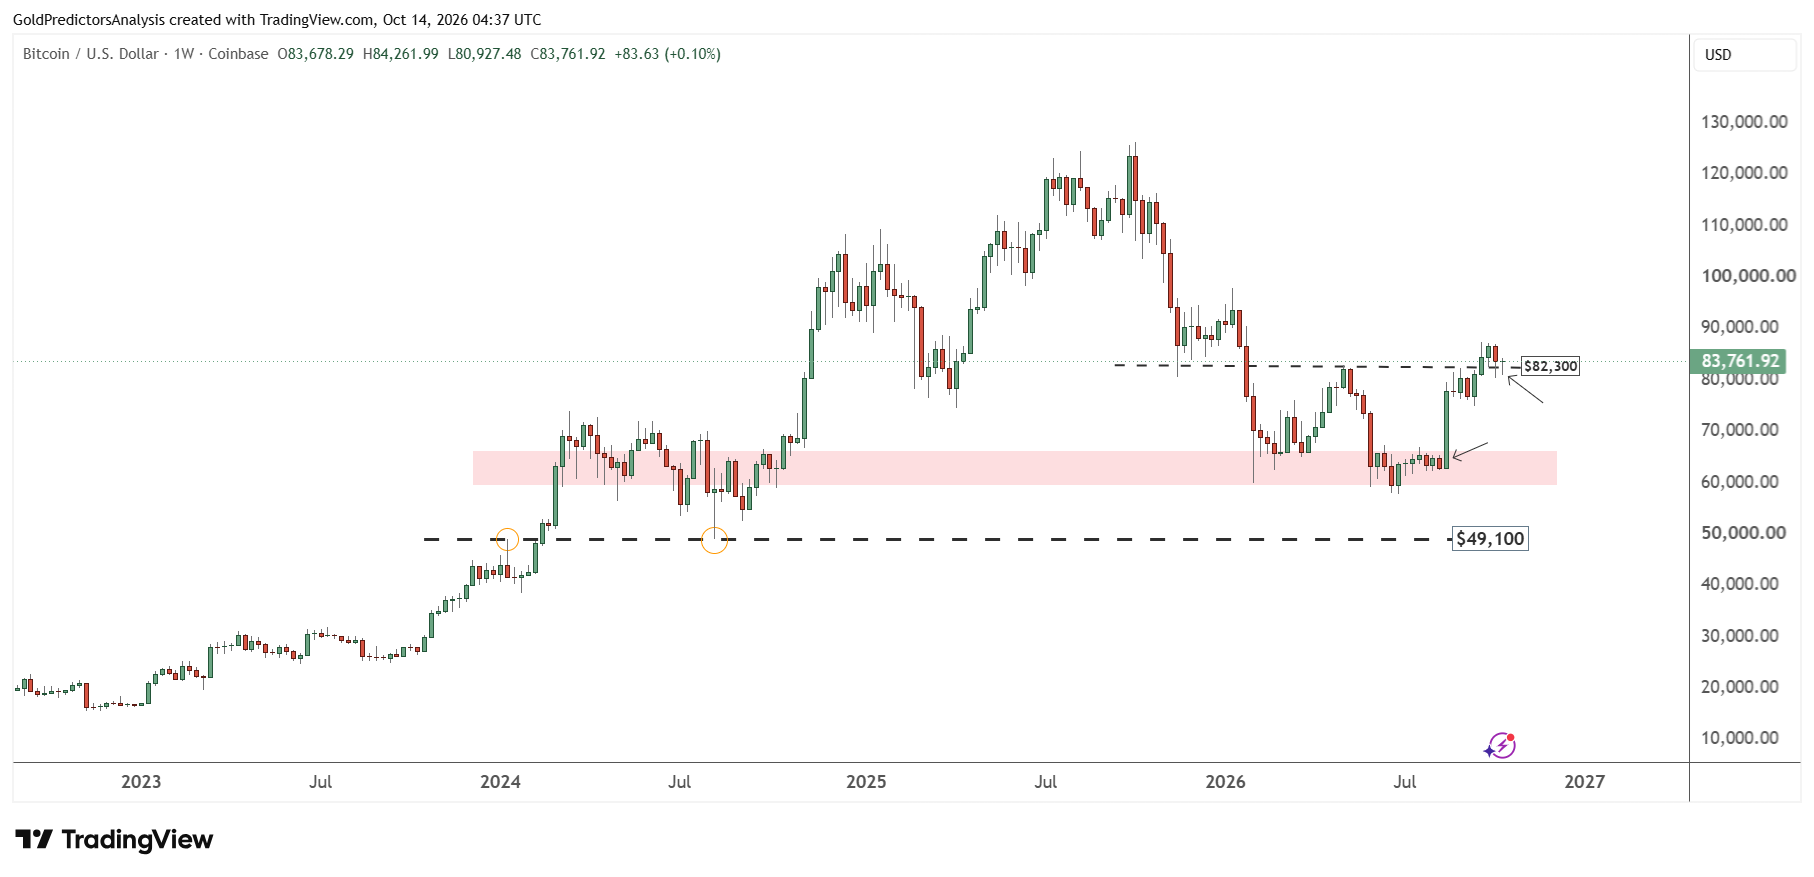
The consolidation from June to August suggests bottoming action. Therefore, the price action remains strongly bullish in the short term. A break above $98,000 in Bitcoin will likely offer a strong rally towards the $120 area.
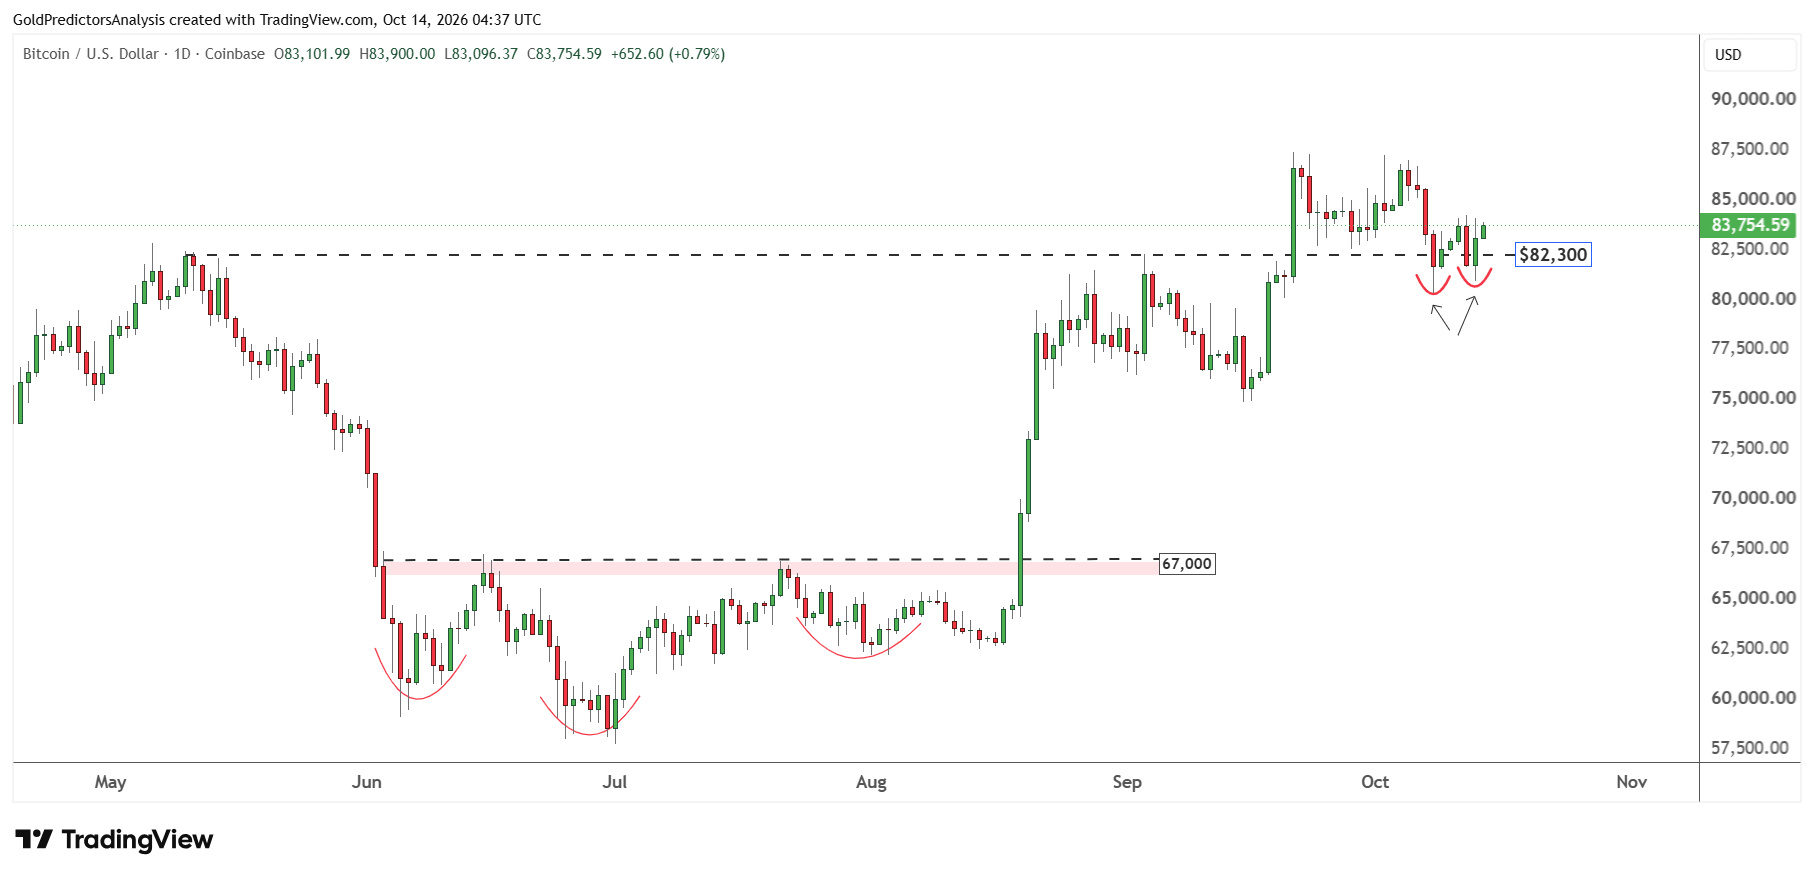
The constructive price action in Bitcoin is also evident on the daily chart. The chart shows the formation of constructive structure from June to August. The price is now again forming a double bottom in October after the rally on Tuesday.
Therefore, a break above the 84,300 level will likely offer a rally back towards the $87,000 area in the short term. However, a break above $87,000 will likely continue the rally towards higher levels.
What to Watch Next: ETF Flows and Bitcoin’s Breakout Levels
Gold could attract more demand in the long term if tensions in the Middle East or financial stress worsen. But high oil prices could keep interest rates elevated and limit the gains in the short term. Bitcoin needs steady ETF inflows to sustain the recovery. A break above $87,400 could open the way towards $97,000-$98,000. A drop below $80,000 would increase the risk of a move towards $75,000. The Bitcoin-to-gold ratio also needs to break above 21 to confirm the strong relative momentum in Bitcoin.