


Earnings Gap Triggers Bullish Reversal
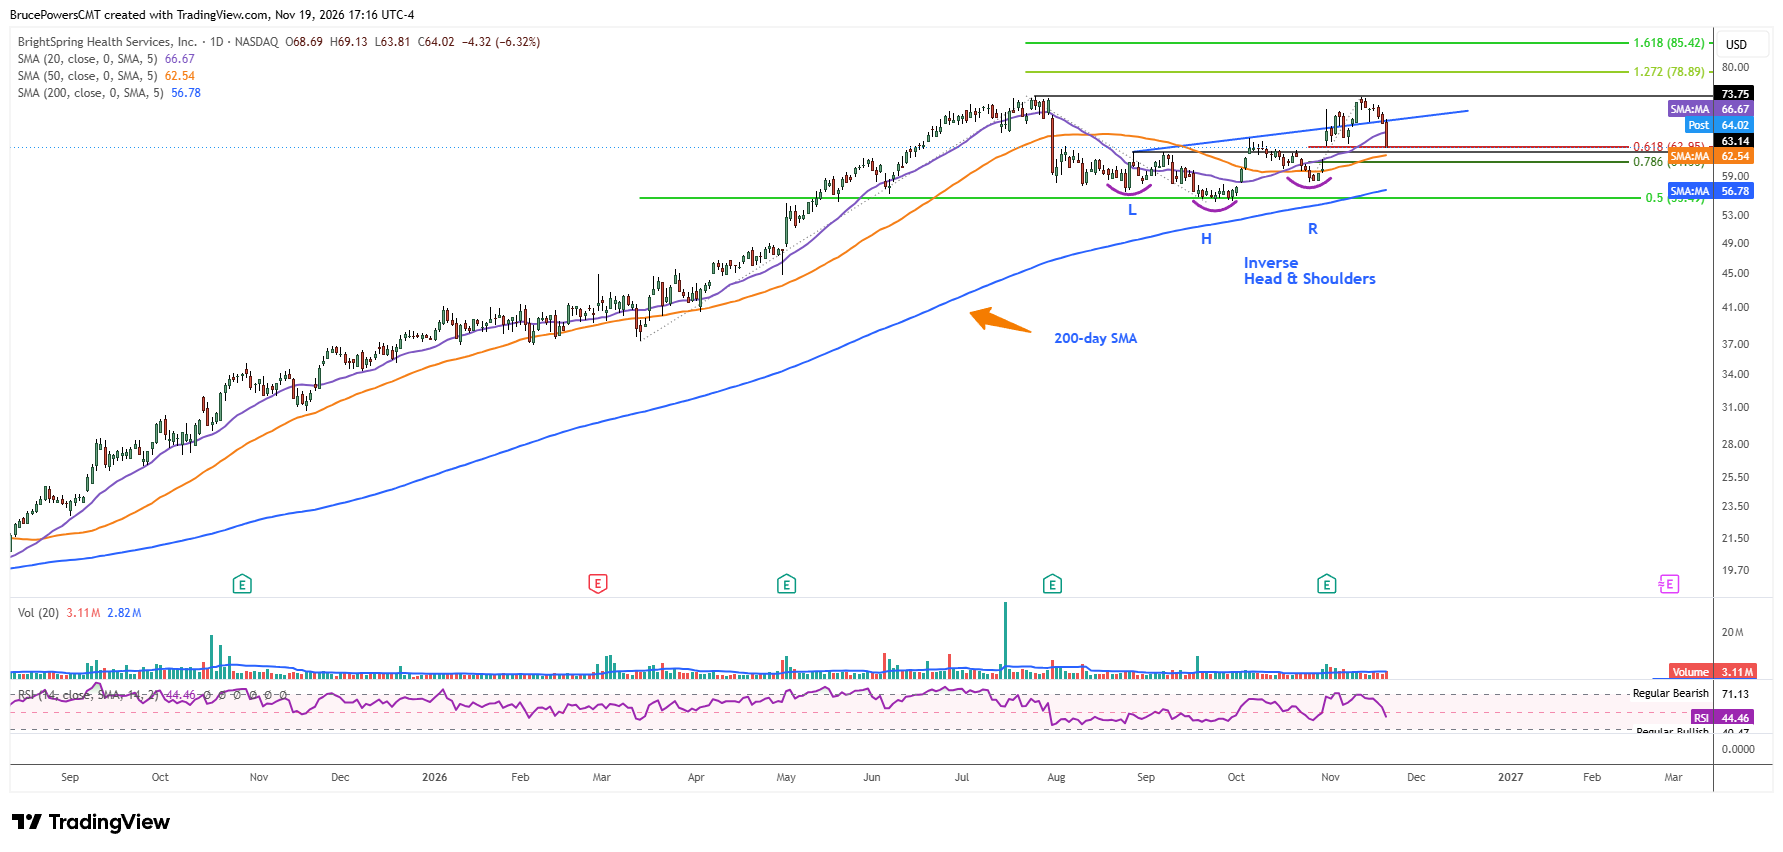
BrightSpring Health Services (BTSG) operates home- and community-based health services. Its stock gapped up on October 30, following its Q3 2026 results reported before the market open. The advance signaled the breakout of an inverse head-and-shoulders pattern and the possible completion of the bearish correction that followed a peak of $73.75 in July. Support for the correction was established with a higher swing low at $54.87 in September, thereby completing a 50% retracement of the prior advance.
The support area was reinforced by the nearby 200-day moving average, which has since risen above the low and is currently near $56.78. In addition to the bullish signal provided by the pattern breakout, the advance also reclaimed the 50-week moving average, which had largely defined dynamic resistance during the formation of the head-and-shoulders bottom.
Breakout Faces Its First Major Test
Following the bullish breakout, a high of $73.53 was reached last week, testing resistance near the $73.75 peak. Sellers then regained control, leading to a pullback to test support levels, a process that remains in play. Although the head-and-shoulders pattern was confirmed, so far, upside follow-through has so far been limited. Nonetheless, a consolidation base has formed in a relatively bullish position near trend highs, suggesting an eventual extension of the long-term bullish trend, if key support levels are retained.
Fibonacci Confluence Defines Critical Support
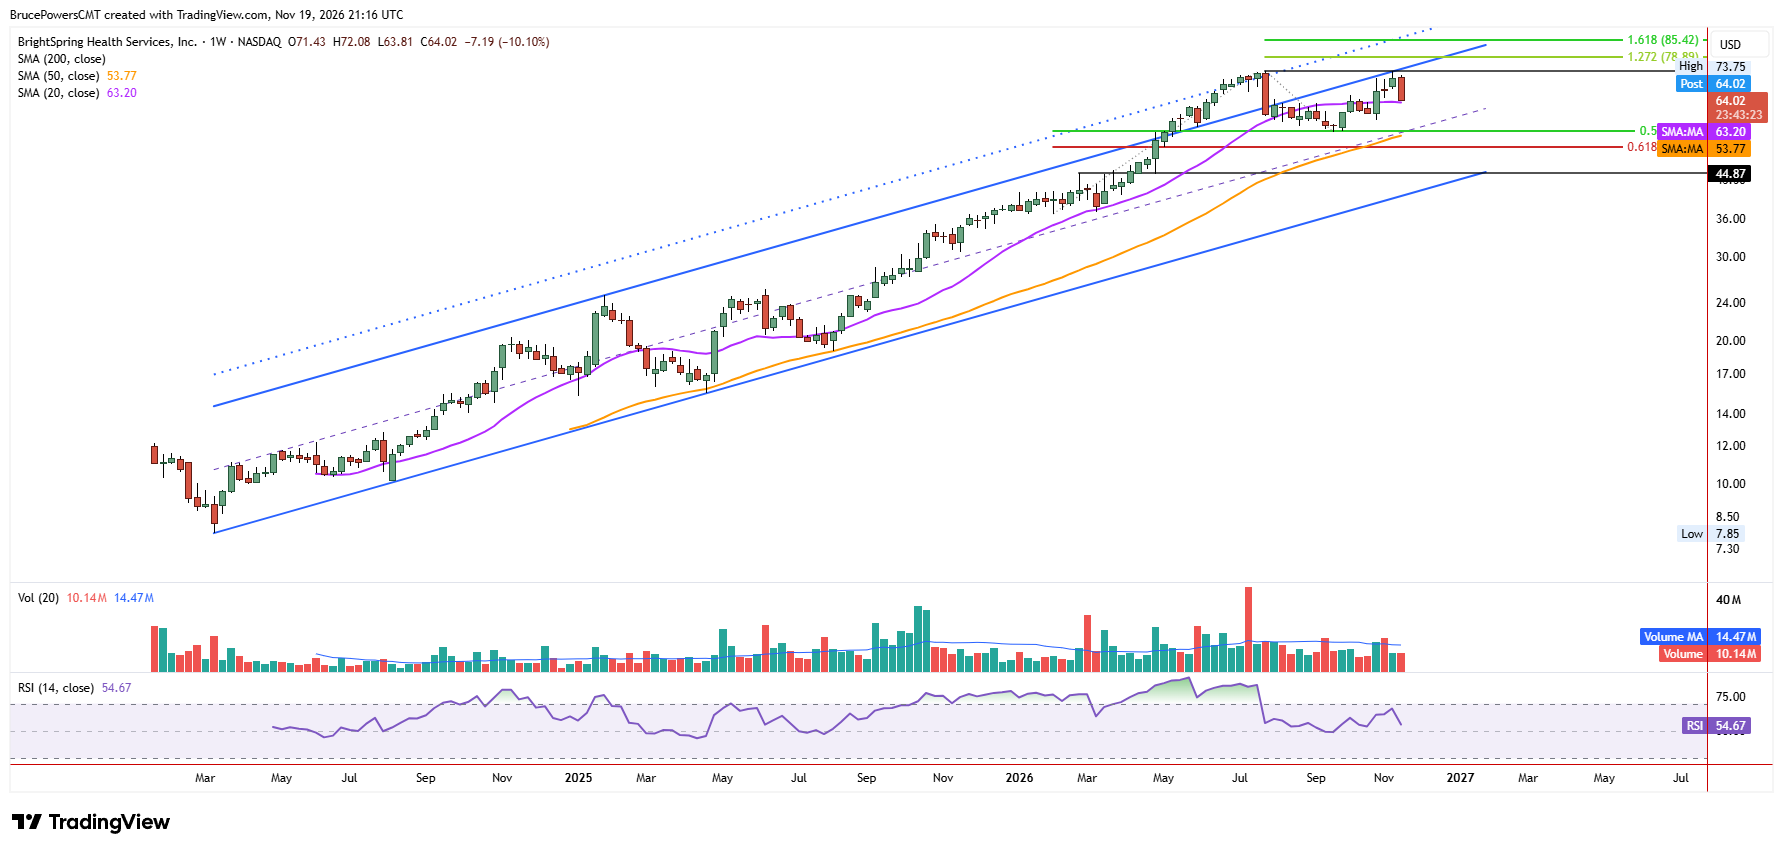
The current pullback reached a three-week low of $63.81 on Thursday, putting BTSG well into the head-and-shoulders consolidation pattern. However, that level falls within a potential support area defined by the 61.8% Fibonacci retracement at $63.95 and the low of the October gap-up day at $64.21. Although the bullish pattern breakout remains valid unless there is a drop below the right shoulder at $58.03, other lower levels may yet be tested. There is a high from August at $63.14 and the rising 50-day moving average near $62.55, followed by the 78.6% Fibonacci retracement at $61.35. A break below that lower Fibonacci level would put the right shoulder at risk.
$78.89 Emerges as an Upside Objective
Given the larger bullish structure and new basing pattern, BTSG is poised to advance higher toward a potential breakout above $73.75, following the current first pullback after the bullish reversal signaled by the head-and-shoulders breakout. Initial new-high resistance targets include the 127.2% Fibonacci extension of the recent decline at $78.89, followed by the 161.8% Fibonacci extension at $85.42. Holding the current support zone would help preserve the bullish reversal structure and keep the potential for a renewed advance toward these higher targets in play.
If you’d like to know more about technical analysis and how traders use it, please visit our educational area.