


Double-Bottom Breakout Revives Bullish Trend
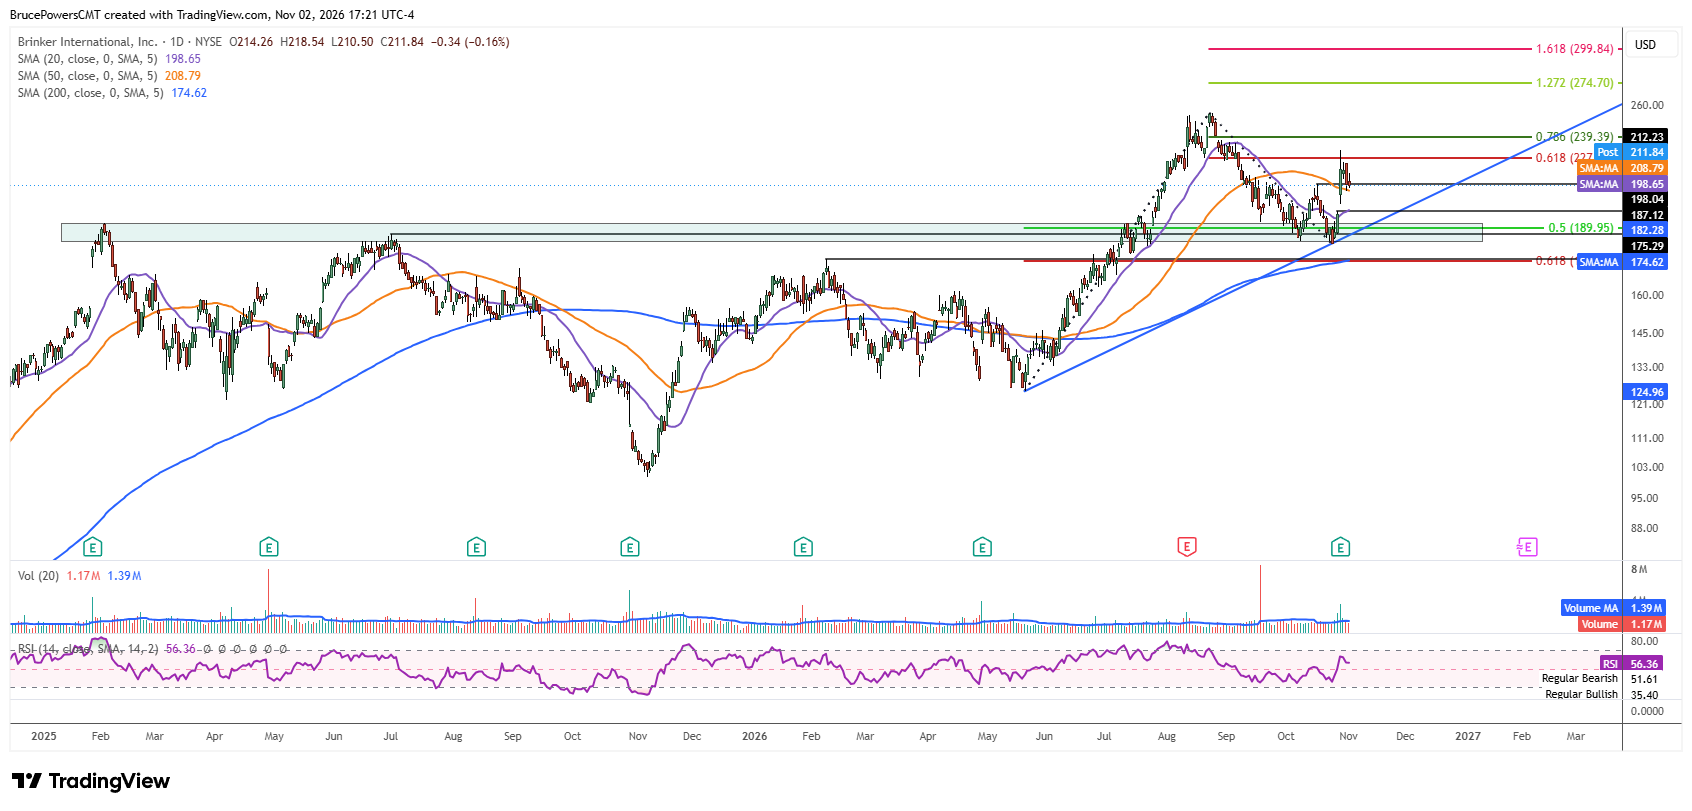
Brinker International, Inc. (EAT), an American multinational hospitality company that owns Chili’s and Maggiano’s Little Italy restaurant chains, triggered a bullish double-bottom reversal signal last week on a rally above the recent lower swing high of $212.23. That breakout suggests the first pullback after a new all-time high of $254.99 was reached in August may have completed.
The low of the pullback at $182.28 resulted in a higher swing low for the rising trend structure. It represented a successful test of support near a key prior resistance zone defined by the $192.22 peak in February 2025 and the slightly lower peak in June at $187.12. Since the support test was followed by a decisive advance, the larger bullish trend is showing signs of resuming. The ability to hold this higher swing low is therefore important to maintaining the bullish technical outlook.
Momentum Recovery Across Multiple Time Frames
In addition to the double bottom reversal signal, strength was confirmed during last week’s advance by a reclaim of the 50-day moving average, with Monday marking the fourth consecutive daily close above that average. In addition, the 20-week moving average was reclaimed after a few weeks of trading below it, and the move was confirmed with a weekly closing price above the 20-week moving average. The recovery of both averages strengthens the bullish case by showing improving momentum across the daily and weekly time frames.
Earnings Catalyst Adds to Upside Potential
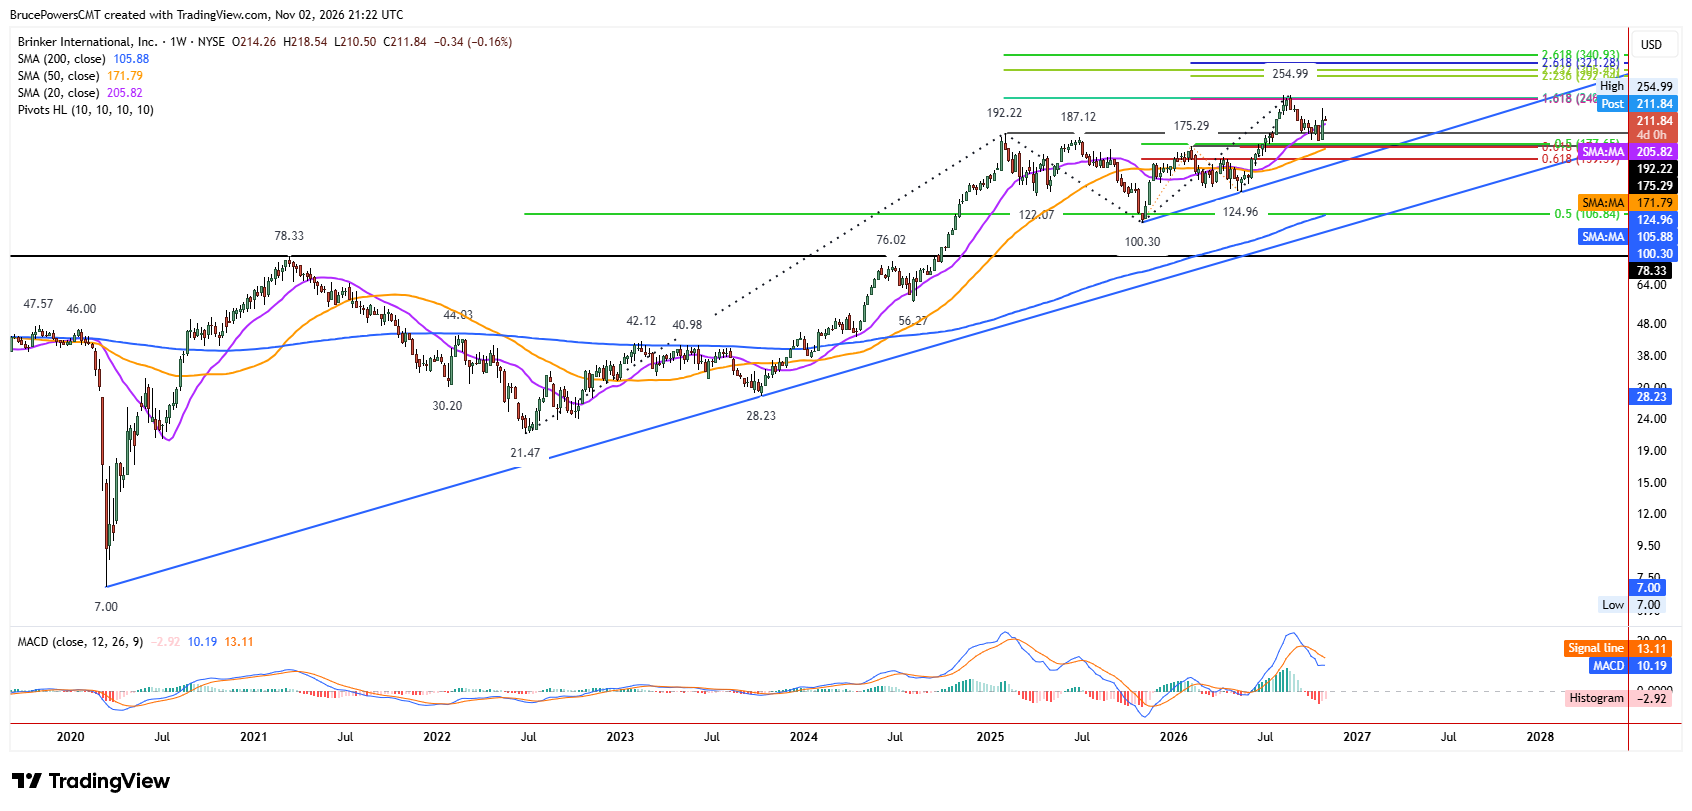
The bullish reversal in EAT followed the release of its fiscal Q1 2027 earnings report last Wednesday, October 28. The following day, several major firms raised or reaffirmed their bullish price targets, ranging from $270 to $300 per share. Technical projections include several levels from $292.64 to $340.94, as shown in the weekly chart. This places the technical projection above the recently established all-time high and provides potential upside objectives if the recovery continues.
Consolidation Sets Up Next Support Test
Nonetheless, this doesn’t mean that EAT will immediately resume its advance. It hit a high of $231.74 last Wednesday and has been consolidating inside that day’s range of $231.74 to $201.83 for the following three sessions. A decline below $201.83 could expose possible dynamic support near the 20-day moving average at $198.65 and last Tuesday’s high of $198.04. This would be the first test of support at the 20-day moving average since last week’s rally above it. Ideally, buyers would defend that average or the nearby prior high if tested, preserving the improving short-term structure. Ultimately, holding these support levels would help confirm that the pullback has ended and that EAT is positioned to resume its larger bullish trend.
If you’d like to know more about technical analysis and how traders use it, please visit our educational area.