Key Insights:
- On Sunday, bitcoin (BTC) slipped by 0.13% to end the session at $17,110. While bearish, BTC avoided sub-$17,000 for the third time since November 7.
- Reports of unusual activity on the Binance exchange and Fed fear weighed late in the session, with the NASDAQ mini adding to the bearish mood.
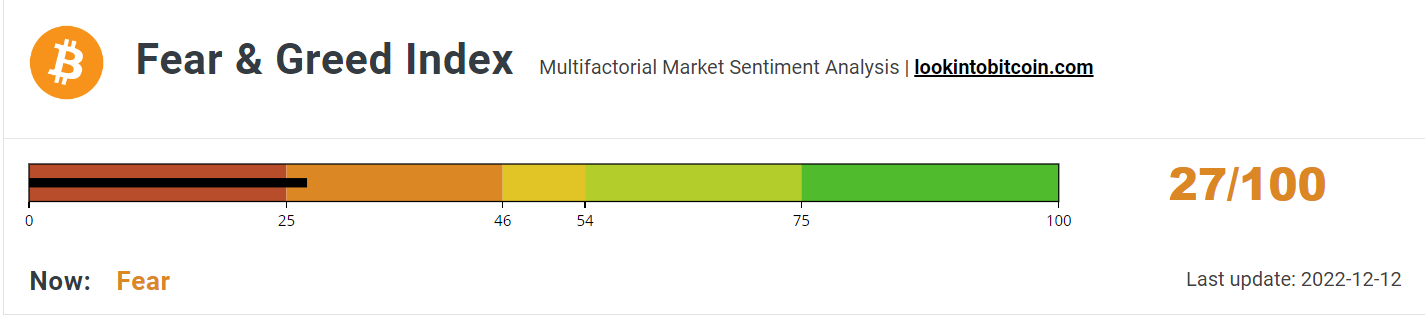
- The Fear & Greed Index rose from 26/100 to 27/100, supported by BTC avoiding sub-$17,000.
On Sunday, bitcoin (BTC) fell by 0.13%. Following a 0.02% loss on Saturday, BTC ended the week down 0.10% to $17,110. Notably, BTC avoided a return to sub-$17,000 for the third consecutive session.
After a bullish morning, BTC struck an early evening high of $17,503. BTC broke through the day’s Major Resistance Levels before sliding to a low of $17,092. However, steering clear of the First Major Support Level (S1) at $17,078, BTC found late support to end the day at $17,110.

Fed Fear Ahead of Tuesday’s CPI Report Left BTC on the Back Foot
On Sunday, trading volumes remained lower as investors shifted focus to tomorrow’s US CPI report and Wednesday’s FOMC interest rate decision.
Recent US economic indicators support a more hawkish Fed move on Wednesday. Significantly, Fed Chair Powell talked about slowing the pace of rate hikes but did not give a timeline. Tuesday’s US CPI report could alter market bets on a 50-basis point rate hike on Wednesday, leaving investors in a cautious mood.
Reports of Binance investigating unusual activity on the exchange added to the bearish mood.
Today, there are no US economic indicators for investors to consider. The lack of stats and FOMC member commentary will likely continue to test buyer appetite ahead of the CPI report. Binance updates will also need monitoring. However, barring negative news, the NASDAQ Index will have more influence.
This morning, the NASDAQ mini was down 23 points.
Bitcoin Price Forecast
Every new Bitcoin analysis as it publishes, today's technical signal and key levels, live price — on one page.
See all Bitcoin forecasts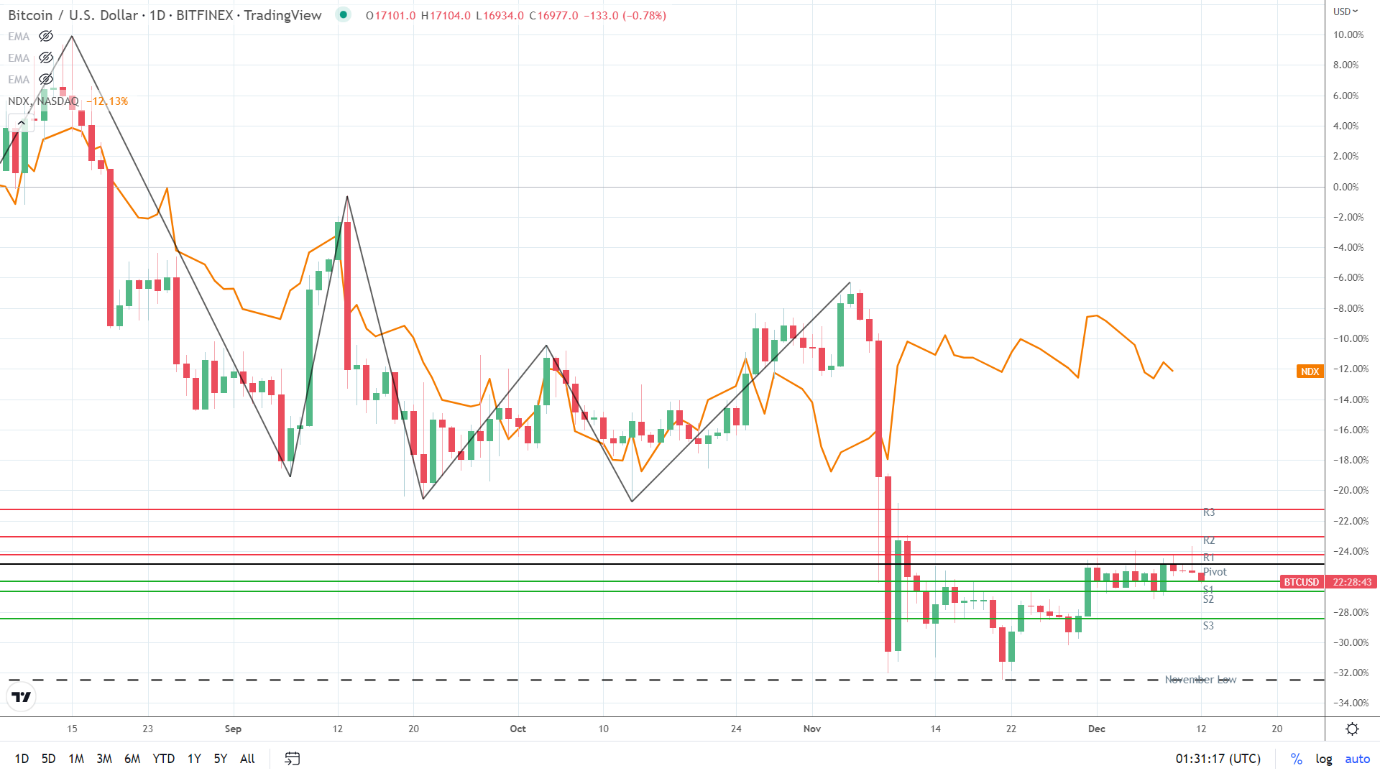
The Fear & Greed Index Inches Higher as BTC Avoids Sub-$17,000
Today, the BTC Fear & Greed Index rose from 26/100 to 27/100. Significantly, the Index avoided a fall back into the Extreme Fear zone despite the bearish BTC session. BTC avoided sub-$17,000 for the third time since the collapse of FTX, which likely provided support.
This week, the US CPI report, the Fed interest rate decision, and FOMC economic projections will have a material impact on investor sentiment. With the US CPI Report likely to impact the Fed’s interest rate decision, uncertainty continues to test buyers following the recent US stats.
Near-term, avoiding sub-20/100 remains the key near-term. The bulls will need to target the pre-FTX collapse November 6 high of 40/100 to support a BTC run at $20,000.
Bitcoin (BTC) Price Action
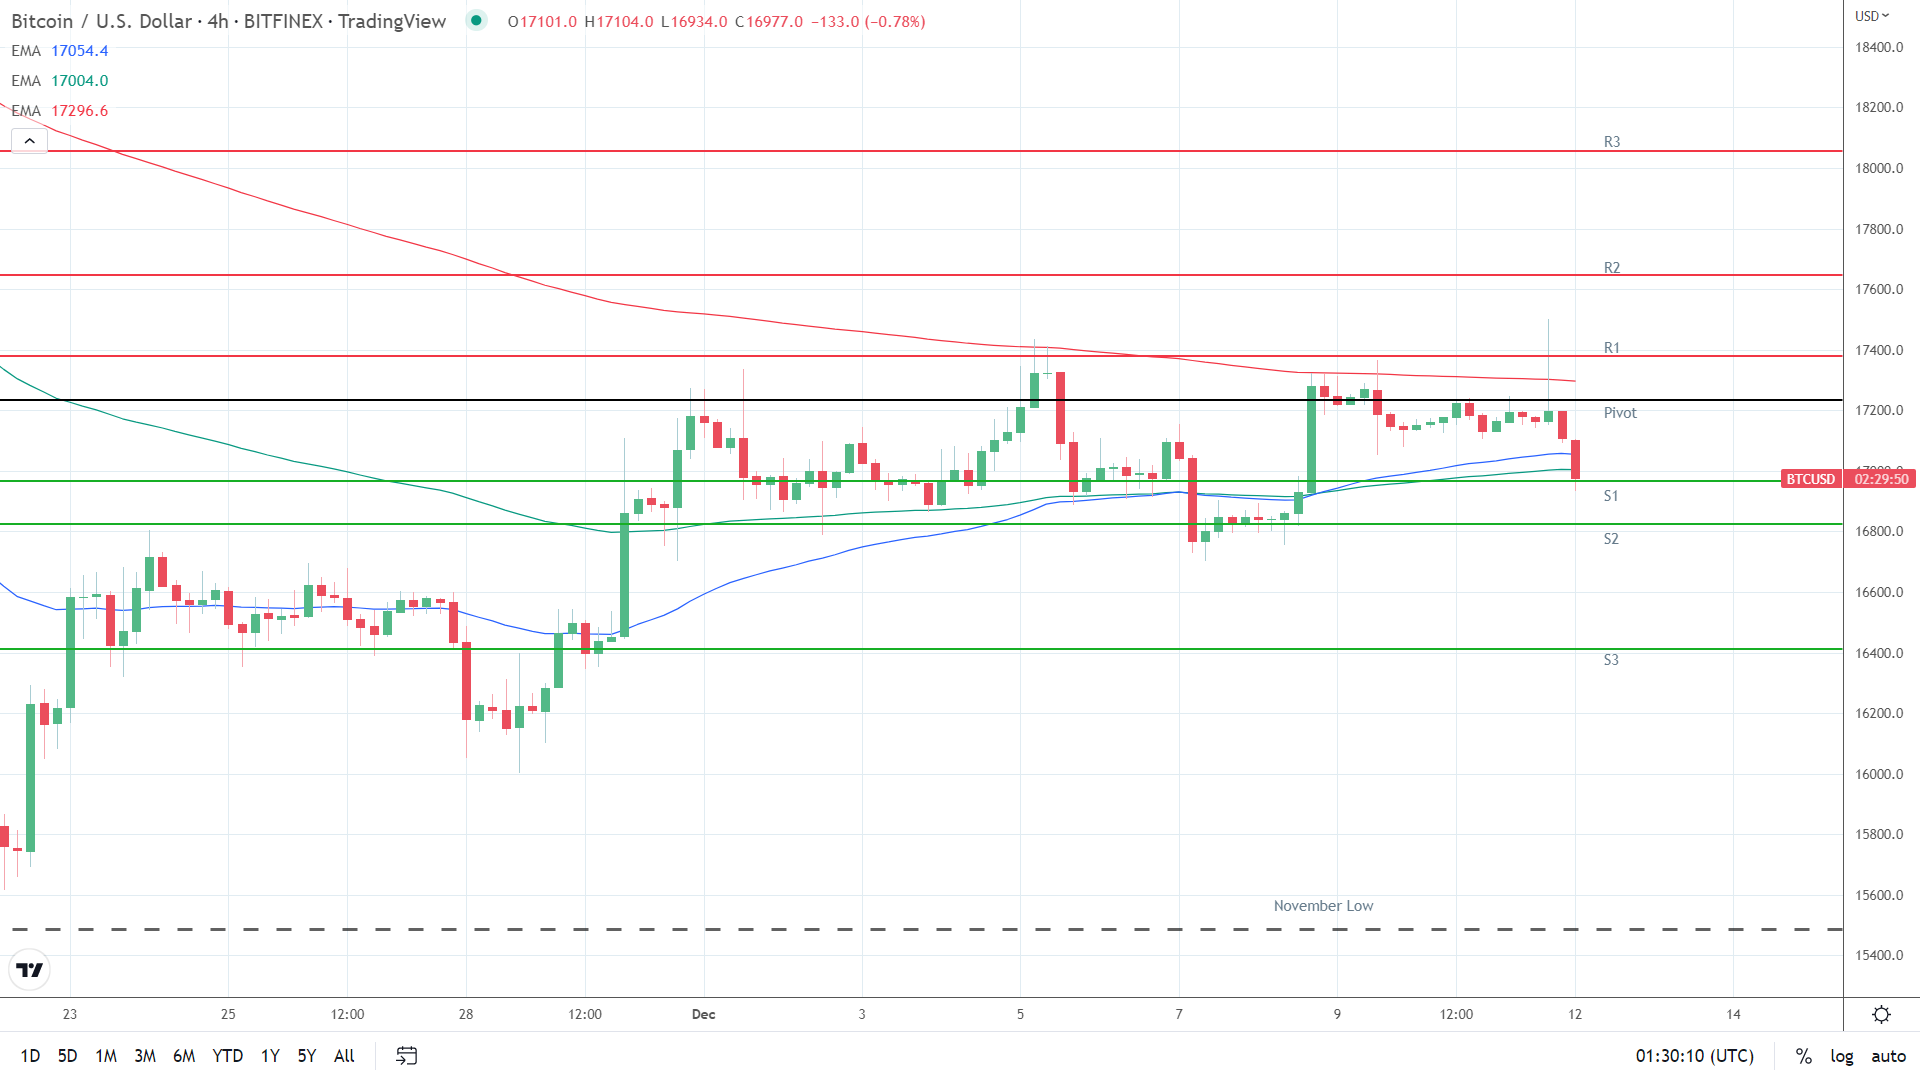
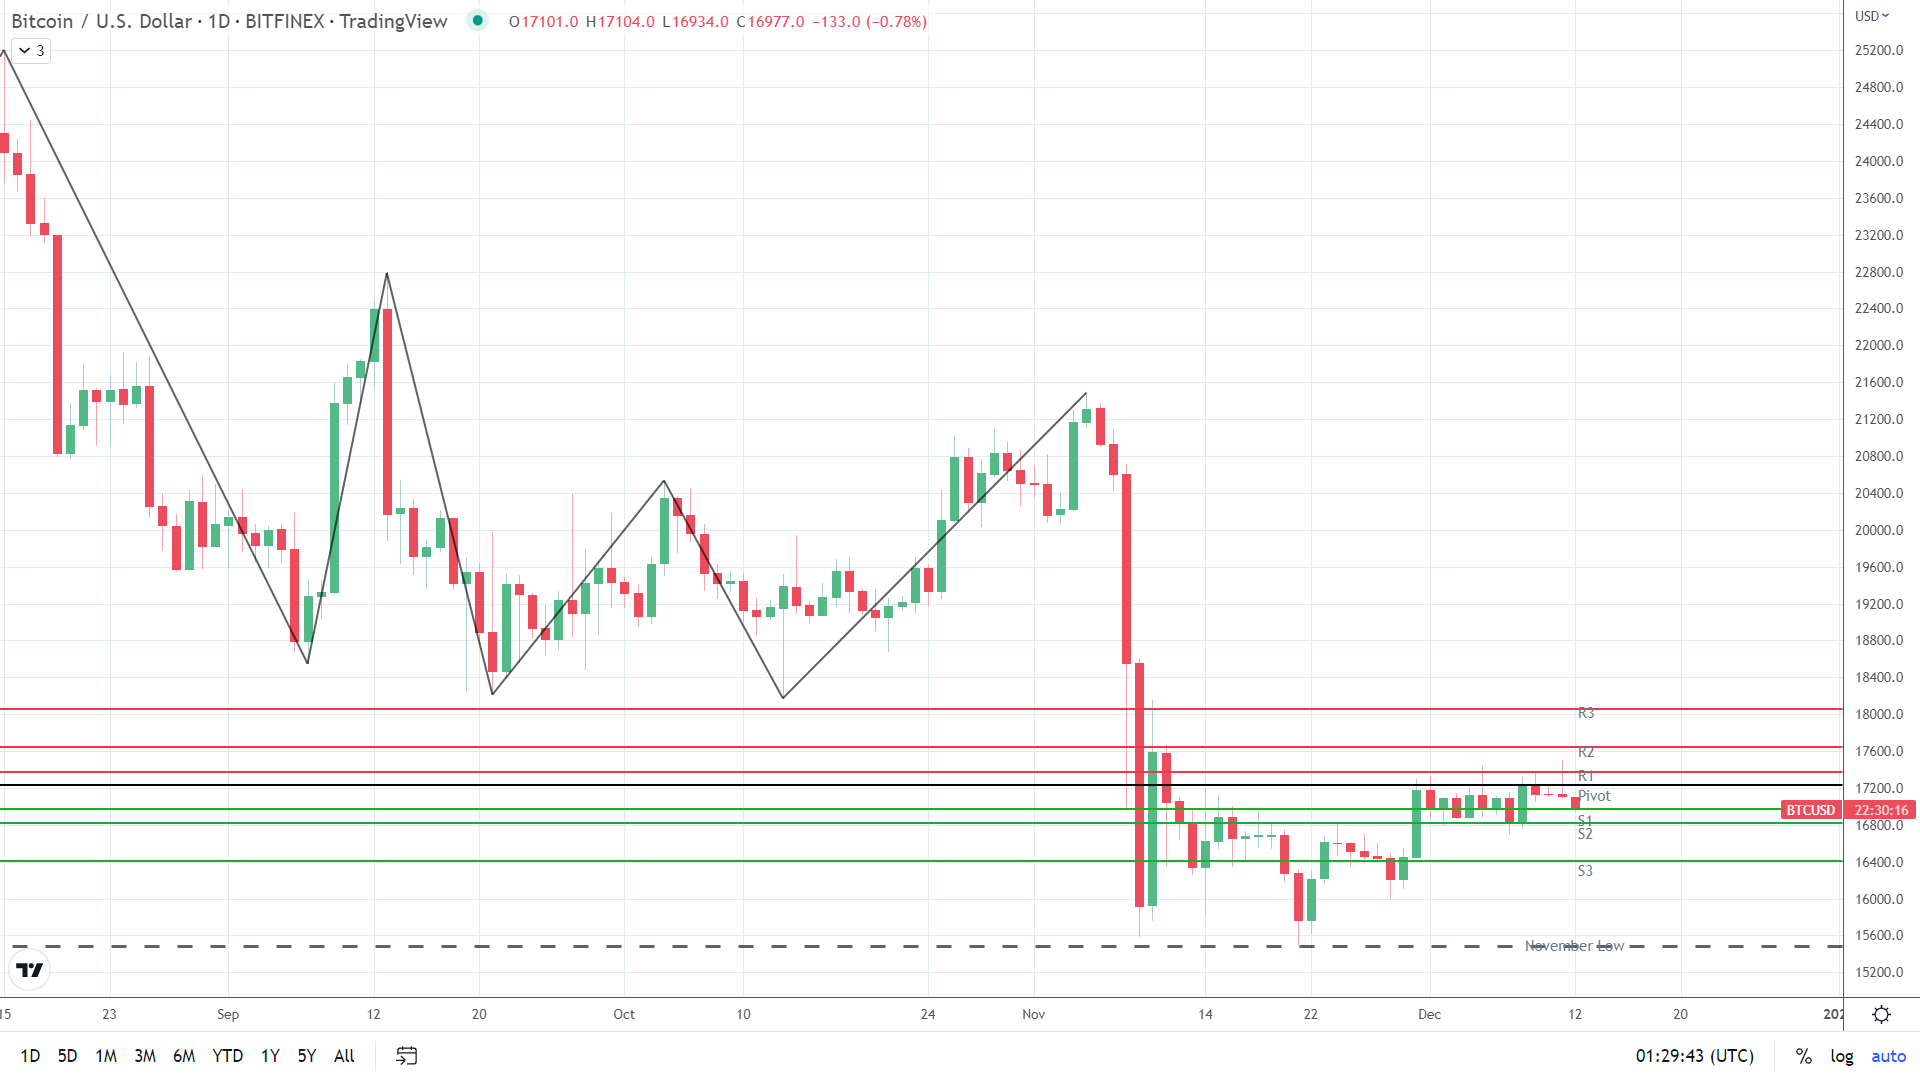
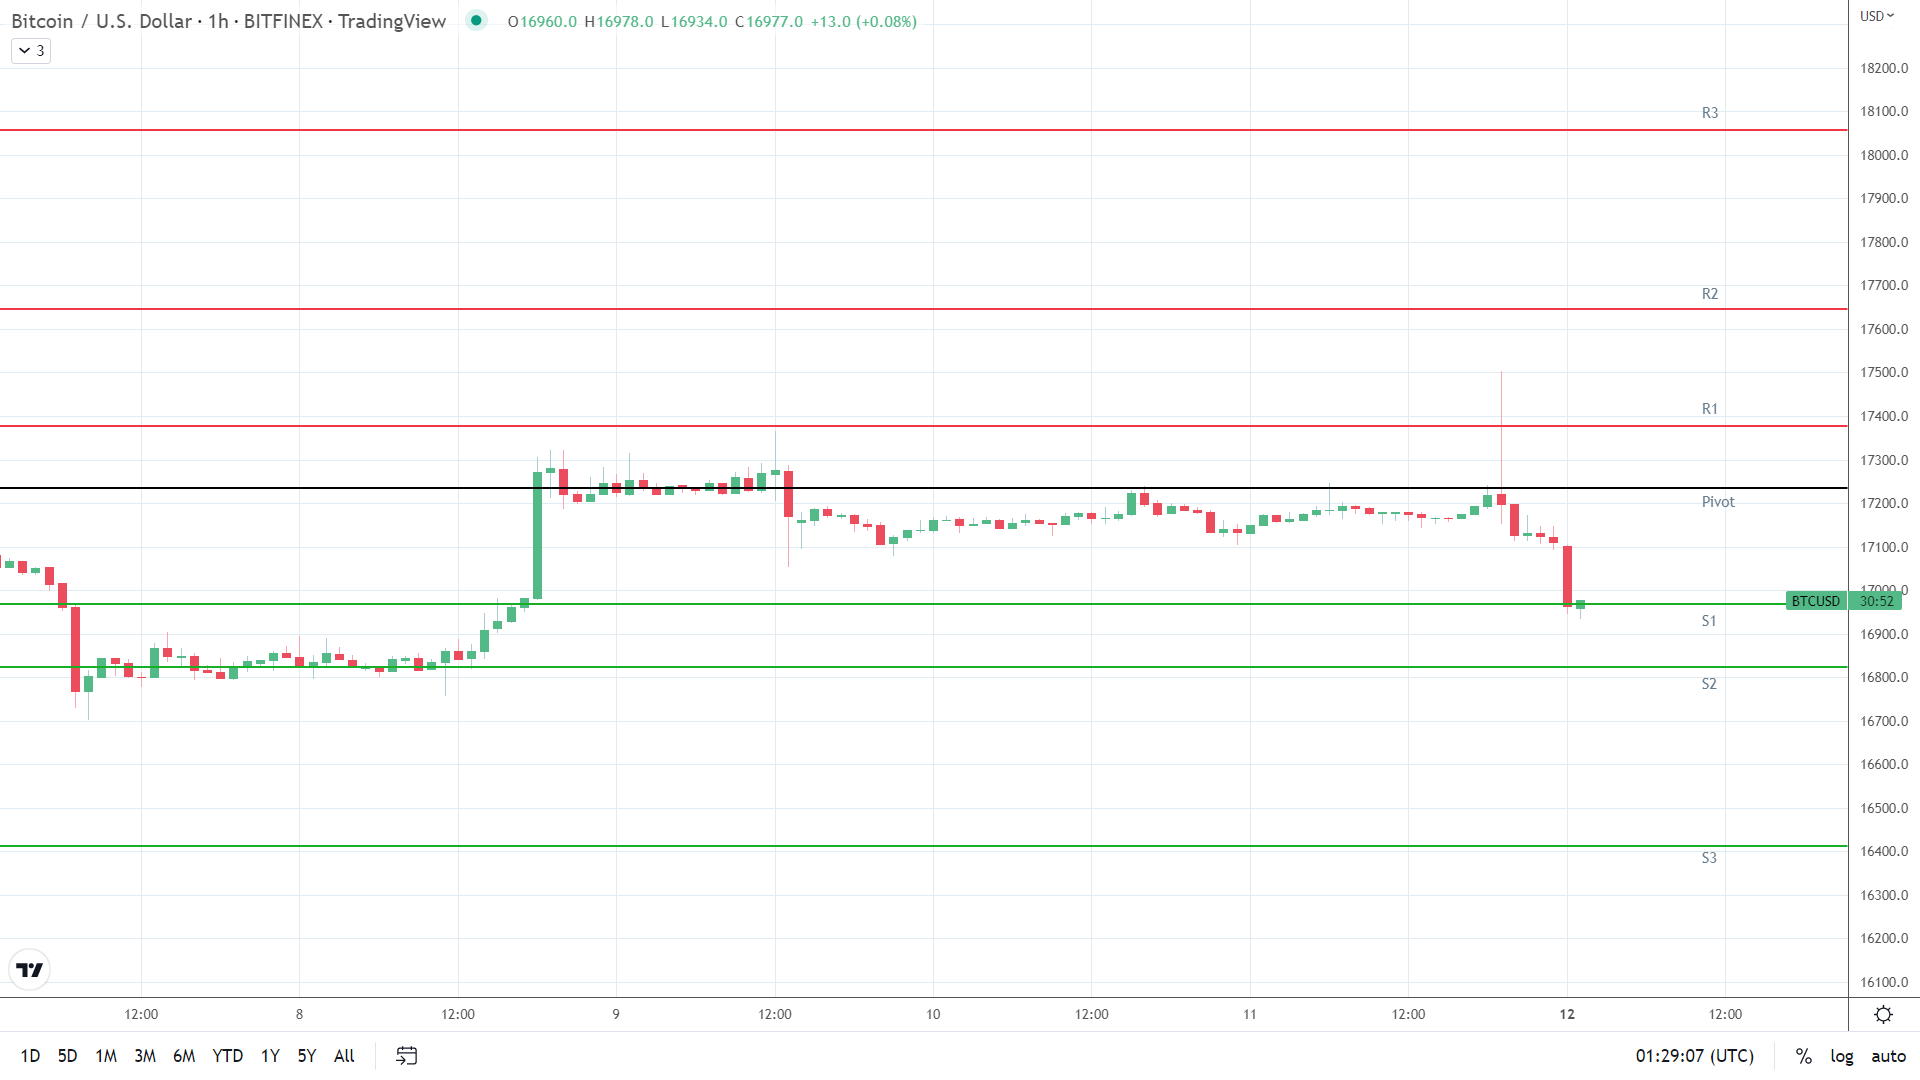
At the time of writing, BTC was down 0.78% to $16,977. A bearish start to the day saw BTC fall from an early high of $17,104 to a low of $16,934. BTC briefly fell through the First Major Support Level (S1) at $16,967.
Technical Indicators
BTC needs to move through the $17,235 pivot to target the First Major Resistance Level (R1) at $17,378 and the Sunday high of $17,503. A BTC return to $17,200 would signal a bullish session.
In the event of an extended rally, BTC would likely break out from the Second Major Resistance Level (R2) at $17,646 to bring $18,000 into view. The Third Major Resistance Level (R3) sits at $18,057.
Failure to move through the pivot would leave the First Major Support Level (S1) at $16,967 in play. Barring an extended sell-off, BTC should avoid sub-$16,500. The Second Major Support Level (S2) at $16,824 should limit the downside. The Third Major Support Level (S3) sits at $16,413.
Looking at the EMAs and the 4-hourly candlestick chart (below), it was a bearish signal. This morning, bitcoin sat below the 100-day EMA, currently at $17,004. The 50-day EMA narrowed to the 100-day EMA, with the 100-day EMA easing back from the 200-day EMA, delivering bearish signals.
A move through the 100-day ($17,004) and 50-day ($17,054) EMAs would support a run at the 200-day EMA ($17,297) and R1 ($17,378). However, failure to move through the 50-day EMA would support a fall through S1 ($16,967) to bring S2 ($16,824) into view.