


Record High Gives Way to Critical Support Test
Chevron Corporation (CVX) extended its bullish trend in October, reaching a new peak of $236.48 last week. That led to a correction accompanied by increased volatility in the broader market, following the release of its Q3 2026 earnings report before the market opened on Friday, October 30. Subsequently, sellers regained control and the stock fell to a low of $212.61 on Thursday, testing a key initial support area.
However, sellers remained in control on Thursday, with a weak close at $212.93, near the lows. This suggests that support could be broken to the downside, resulting in a continuation of the bearish correction to lower support levels. Alternatively, support could hold, allowing the larger bullish trend to retain its dominance.
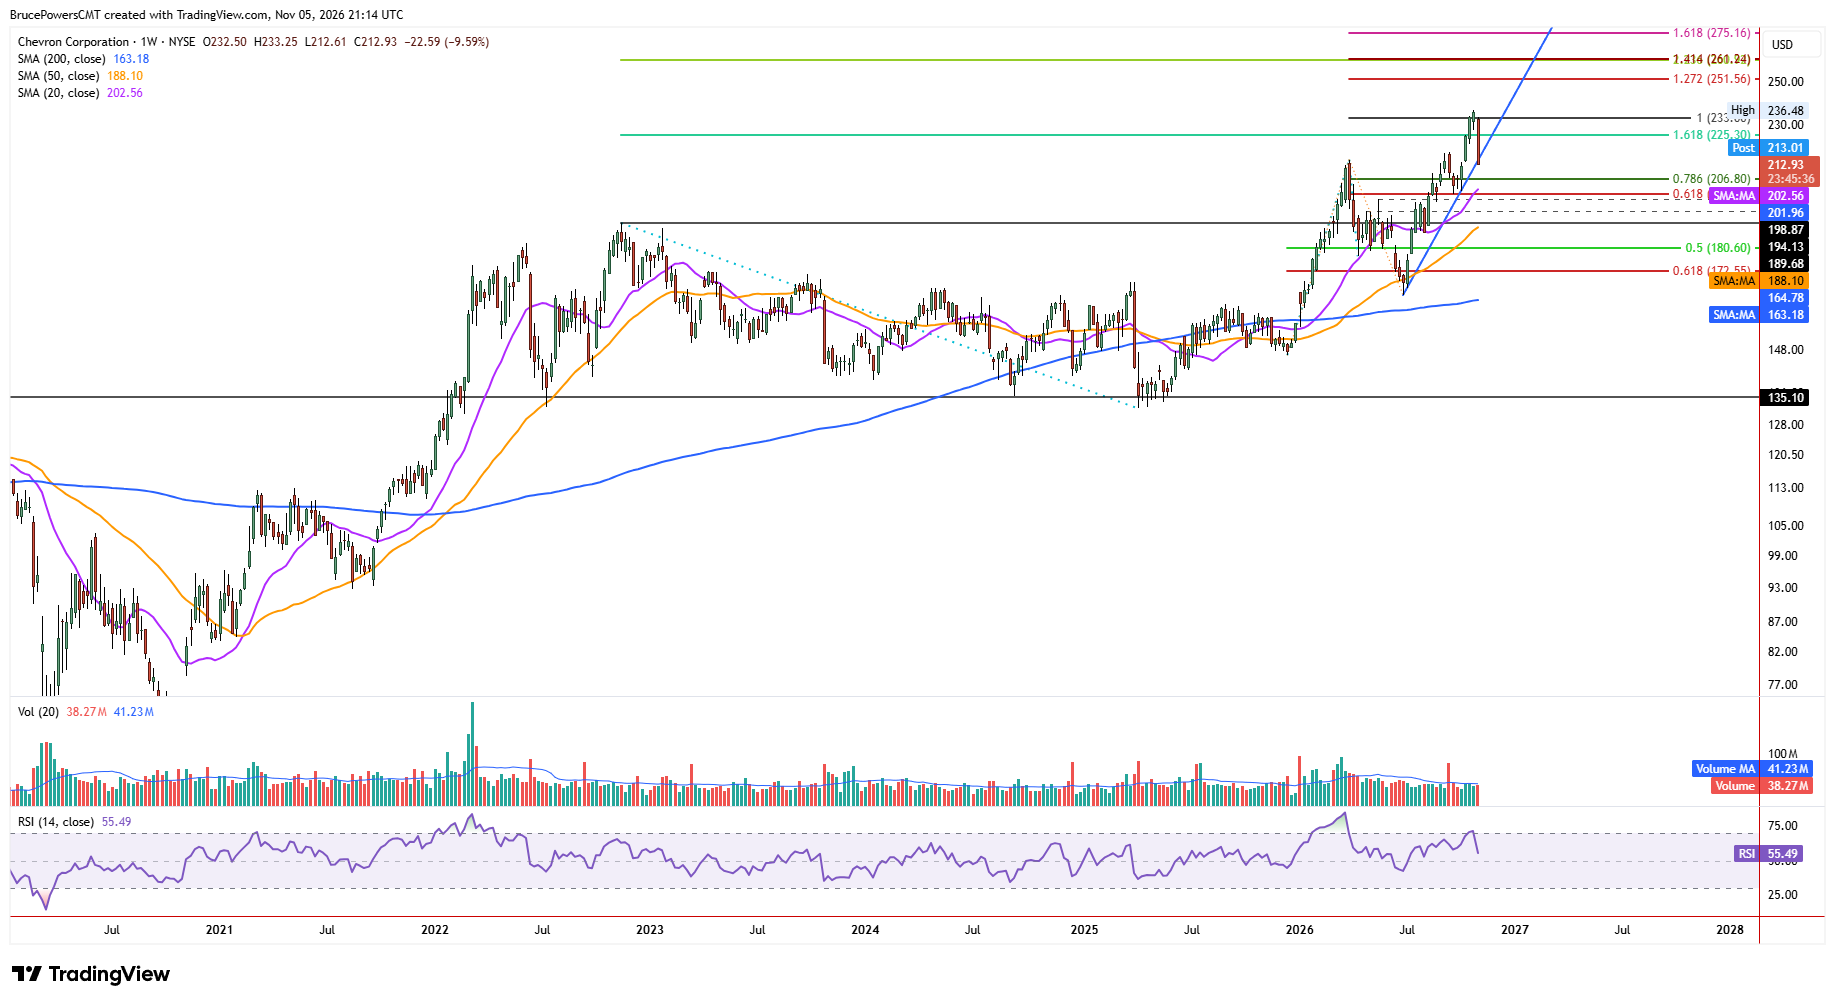
Weekly Chart: Former Resistance Becomes Support
The prior peak at $214.71 from March marked the top of a basing pattern that took the form of a cup-with-handle pattern. This is the first pullback after that base breakout, and it presents important information about what could happen next. Once the first pullback to test support near prior resistance is complete, the bullish trend may be ready to continue.
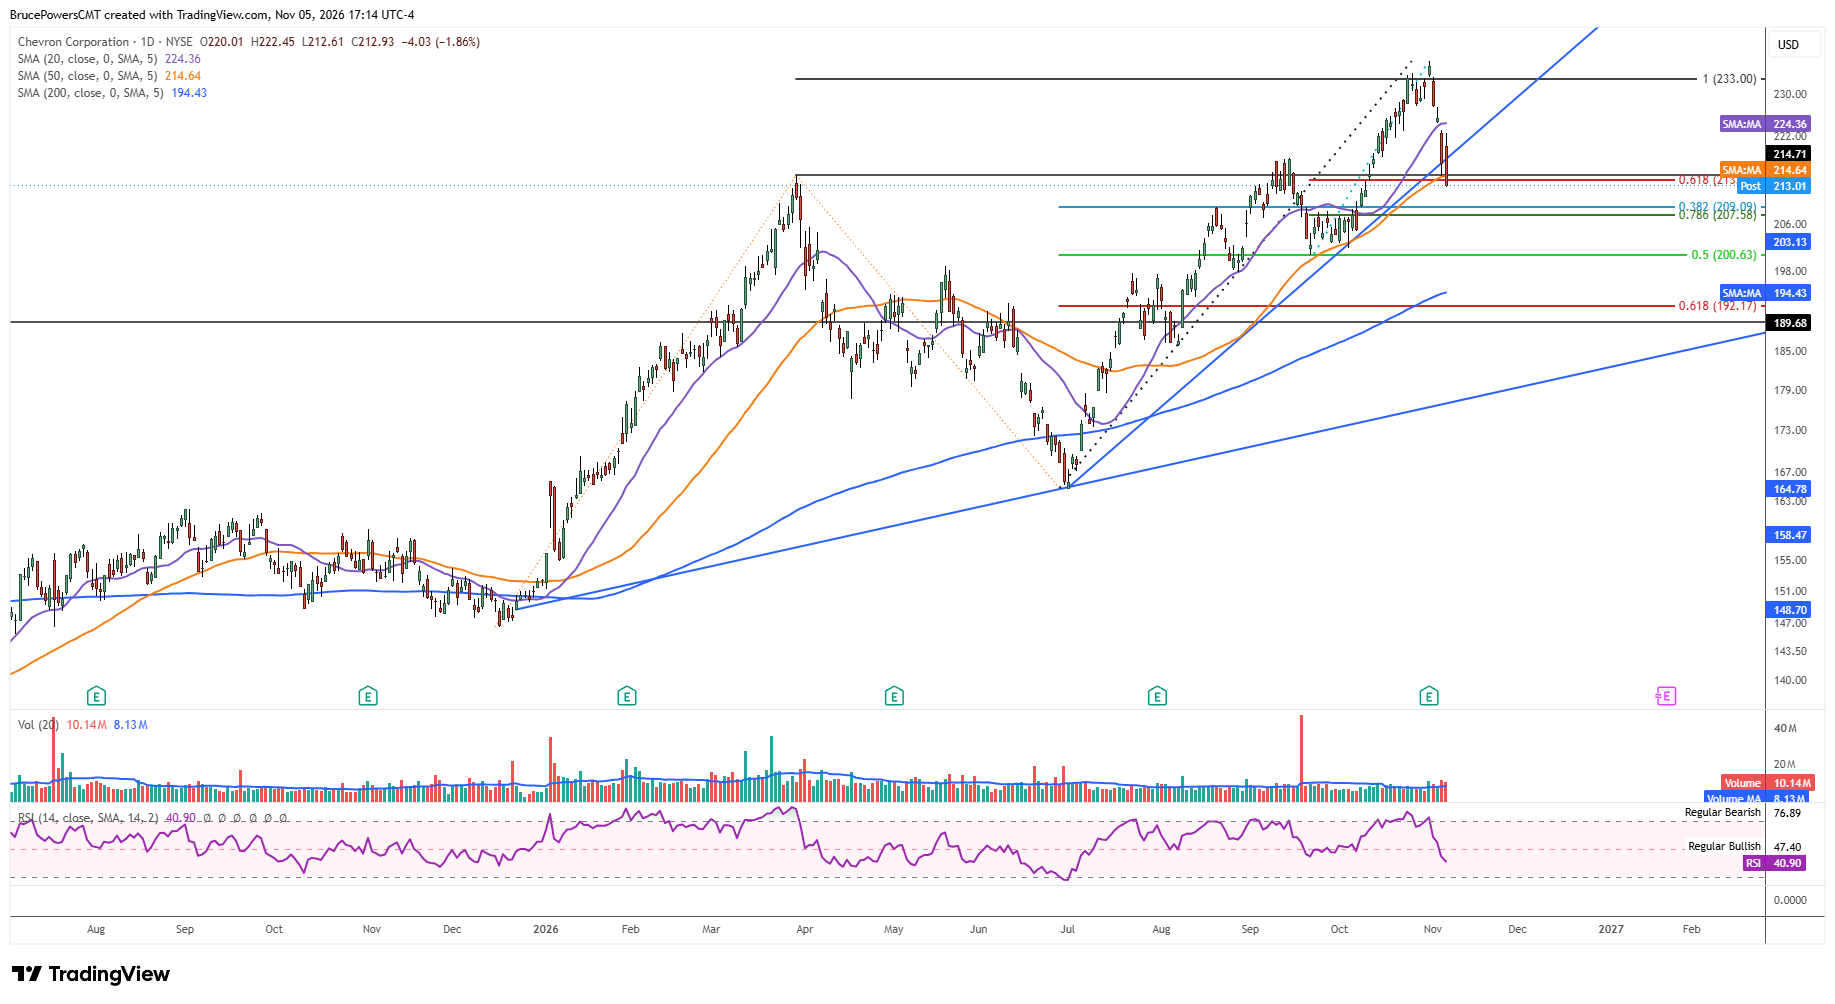
Daily Chart: Moving Average Under Pressure
Consequently, a decisive decline below Thursday’s low of $212.61 would signal a continuation of the decline and a break below a key support zone. Since the 50-day moving average was reclaimed in mid-July it has done a good job of defining dynamic support for the advance. Currently, it is near $214.64, and it held as support during the prior pullback in September, adding to its significance as a key near-term trend indicator. There are other indicators that reinforce the support area as well, further increasing its significance as a potential breakdown level.
Lower Support Levels Define Downside Risk
If CVX extends the bearish correction below $212.61, a break below the 50-day moving average will also be confirmed. The next lower support range would then be between $209 to $207.58, derived from a prior resistance zone and two Fibonacci retracement levels for different upswings. But if support holds and buyers regain control above the swing low at $200.78, the correction may have reached its completion.
If you’d like to know more about technical analysis and how traders use it, please visit our educational area.