
Advertisement
Advertisement
Comex Gold Futures (GC) Technical Analysis – November 13, 2015 Forecast
By:
December Comex Gold is trading slightly higher ahead of the regular session opening and the release of the U.S. retail sales report. This report is likely
December Comex Gold is trading slightly higher ahead of the regular session opening and the release of the U.S. retail sales report. This report is likely to trigger a volatile reaction on increased volume after a week that featured a sideways-to-lower trade on below average volume and volatility.
The U.S. retail sales report is important because it will tell the Fed if consumers are helping to strengthen the economy. Month-to-month core retail sales are expected to be up 0.4%. Month-to-month retail sales are expected to show a rise of 0.3%.
Month-to-month PPI is expected to rise 0.2%. Core PPI is expected to be up 0.1%. Preliminary University of Michigan Consumer Sentiment is estimated at 91.3.
Stronger-than-expected retail sales should solidify a rate hike by the Fed in December. This should underpin the U.S. Dollar and weaken gold.
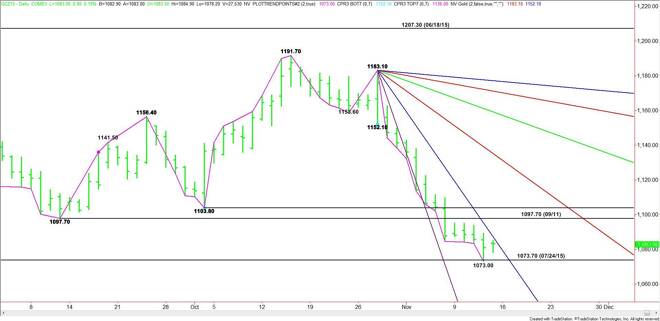
Technically, the main trend is down according to the daily swing chart. Yesterday, gold spiked lower to $1073.00 before closing at $1081.00. This was essentially a successful test of the July 24 main bottom at $1073.70.
Based on the close at $1081.00, the key angle to watch is $1087.10. Trader reaction to this angle will likely determine the direction of the market today.
A sustained move over $1087.10 will signal the presence of buyers. This could trigger a further rally with previous bottoms at $1097.10 and $1103.80 the first two potential targets. The daily chart indicates the market could begin to expand to the upside if $1103.80 is taken out with conviction.
A break through $1073.00 will signal a resumption of the selling. The next potential target under this low is the psychological $1050.00 level.
Watch the price action and order flow at $1087.10 today. Trader reaction to this level will tell us whether the bulls or the bears are in control. Also watch for a potential closing price reversal bottom since today’s session begins with gold in the window of time for this chart pattern.
Taking out $1073.00 early in the session then overtaking $1081.00 later will indicate exhaustion and that the last of the sellers are finally out of the market. This could trigger the start of a meaningful short-covering rally.
About the Author
James Hyerczykauthor
James Hyerczyk is a U.S. based seasoned technical analyst and educator with over 40 years of experience in market analysis and trading, specializing in chart patterns and price movement. He is the author of two books on technical analysis and has a background in both futures and stock markets.


Advertisement