



July Comex High Grade Copper futures finished sharply lower last week, pressured by a stronger dollar, rising interest rates and low demand.
Weekly Swing Chart Technical Analysis
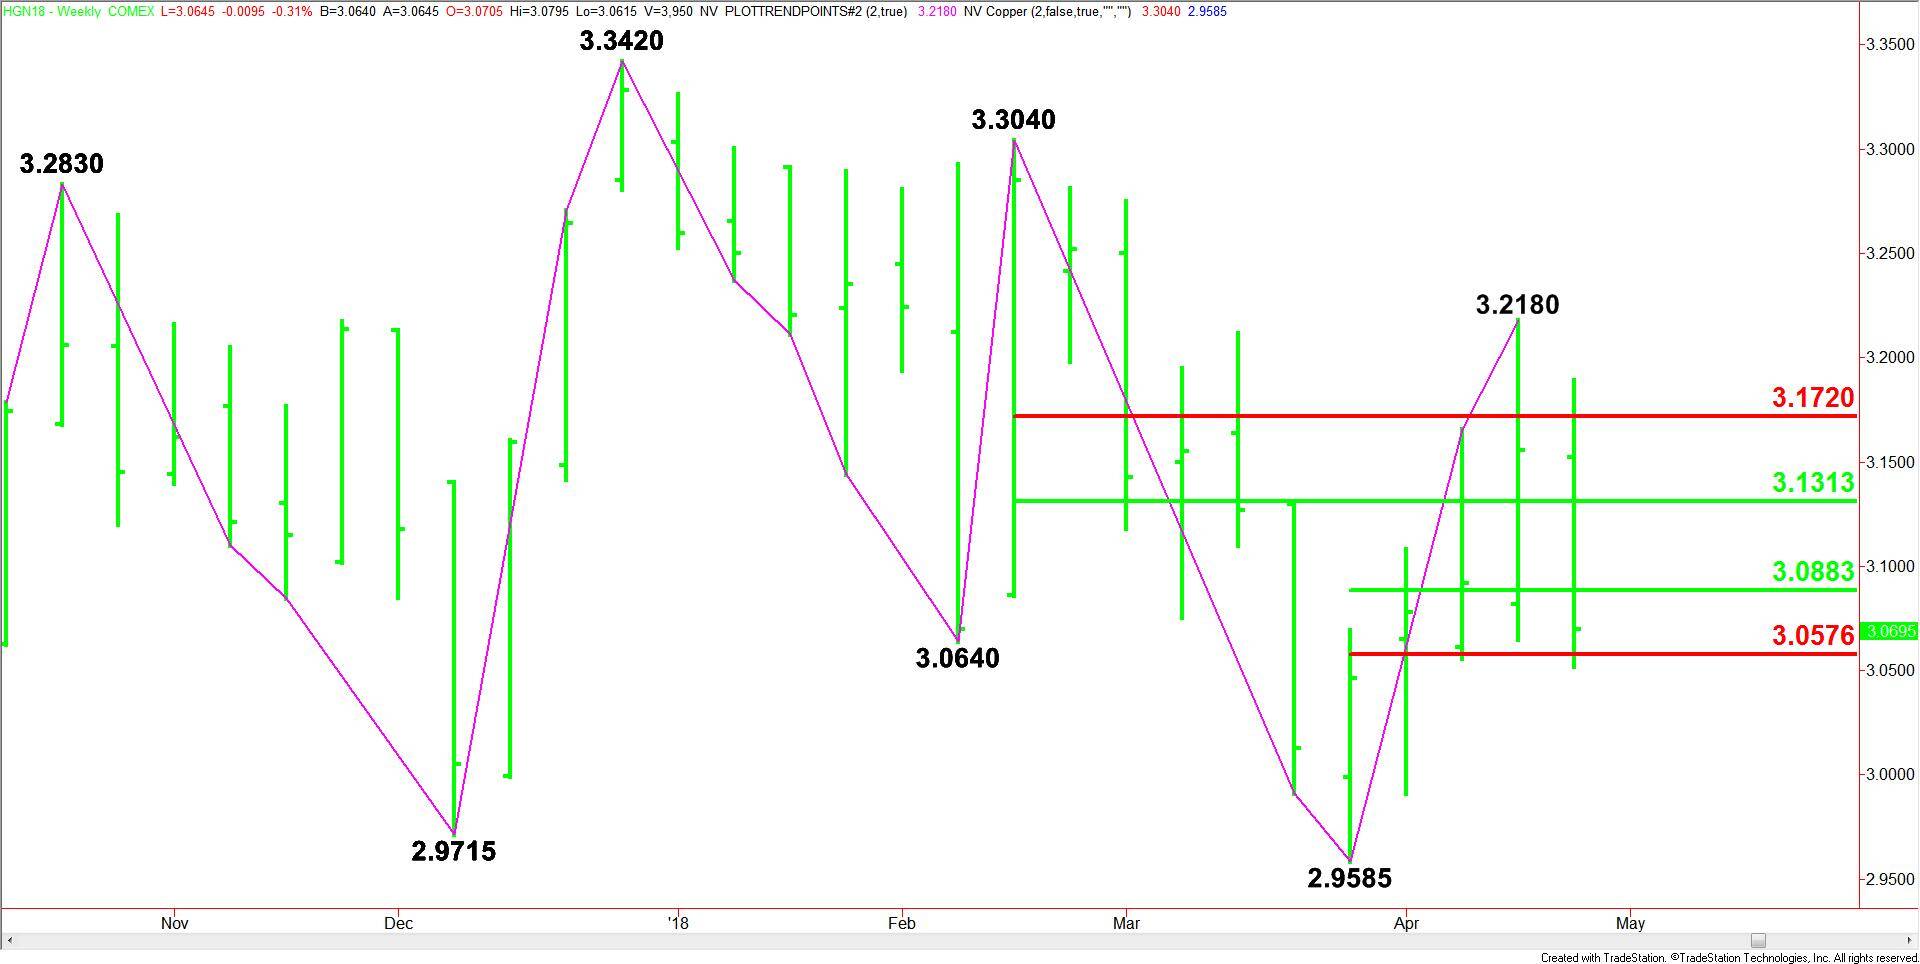
The main trend is down according to the weekly swing chart. A trade through $2.9585 will reaffirm the downtrend.
The minor trend is also down. A move through $3.2180 will change the main trend to up and shift momentum to the upside.
The main range is $3.3040 to $2.9585. Its retracement zone at $3.1315 to $3.1720 is resistance.
The short-term range is $2.9585 to $3.2180. Its retracement zone at $3.0885 to $3.0575 is support.
Weekly Swing Chart Technical Forecast
Based on last week’s close at $3.0695, the direction of the copper market today is likely to be determined by trader reaction to the short-term retracement zone.
A sustained move under $3.0575 will indicate the presence of sellers. The daily chart is wide open to the downside so a failure at this level could trigger an acceleration to the downside with $2.9585 the next major downside target.
A sustained move over $3.0885 will signal the presence of buyers. This could lead to another challenge of the main 50% level at $3.1315. Since the main trend is down, we could see a technical bounce on the first test of this level.
Overtaking $3.1315 could create the upside momentum needed to challenge the main Fib level at $3.1720. We could see another technical bounce on the first test of this level.
Look for the start of an acceleration to the upside on a sustained move over $3.1720.