



March Comex High Grade Copper futures settled slightly lower on Thursday but sharply lower for the month on concerns over weakening demand from China.
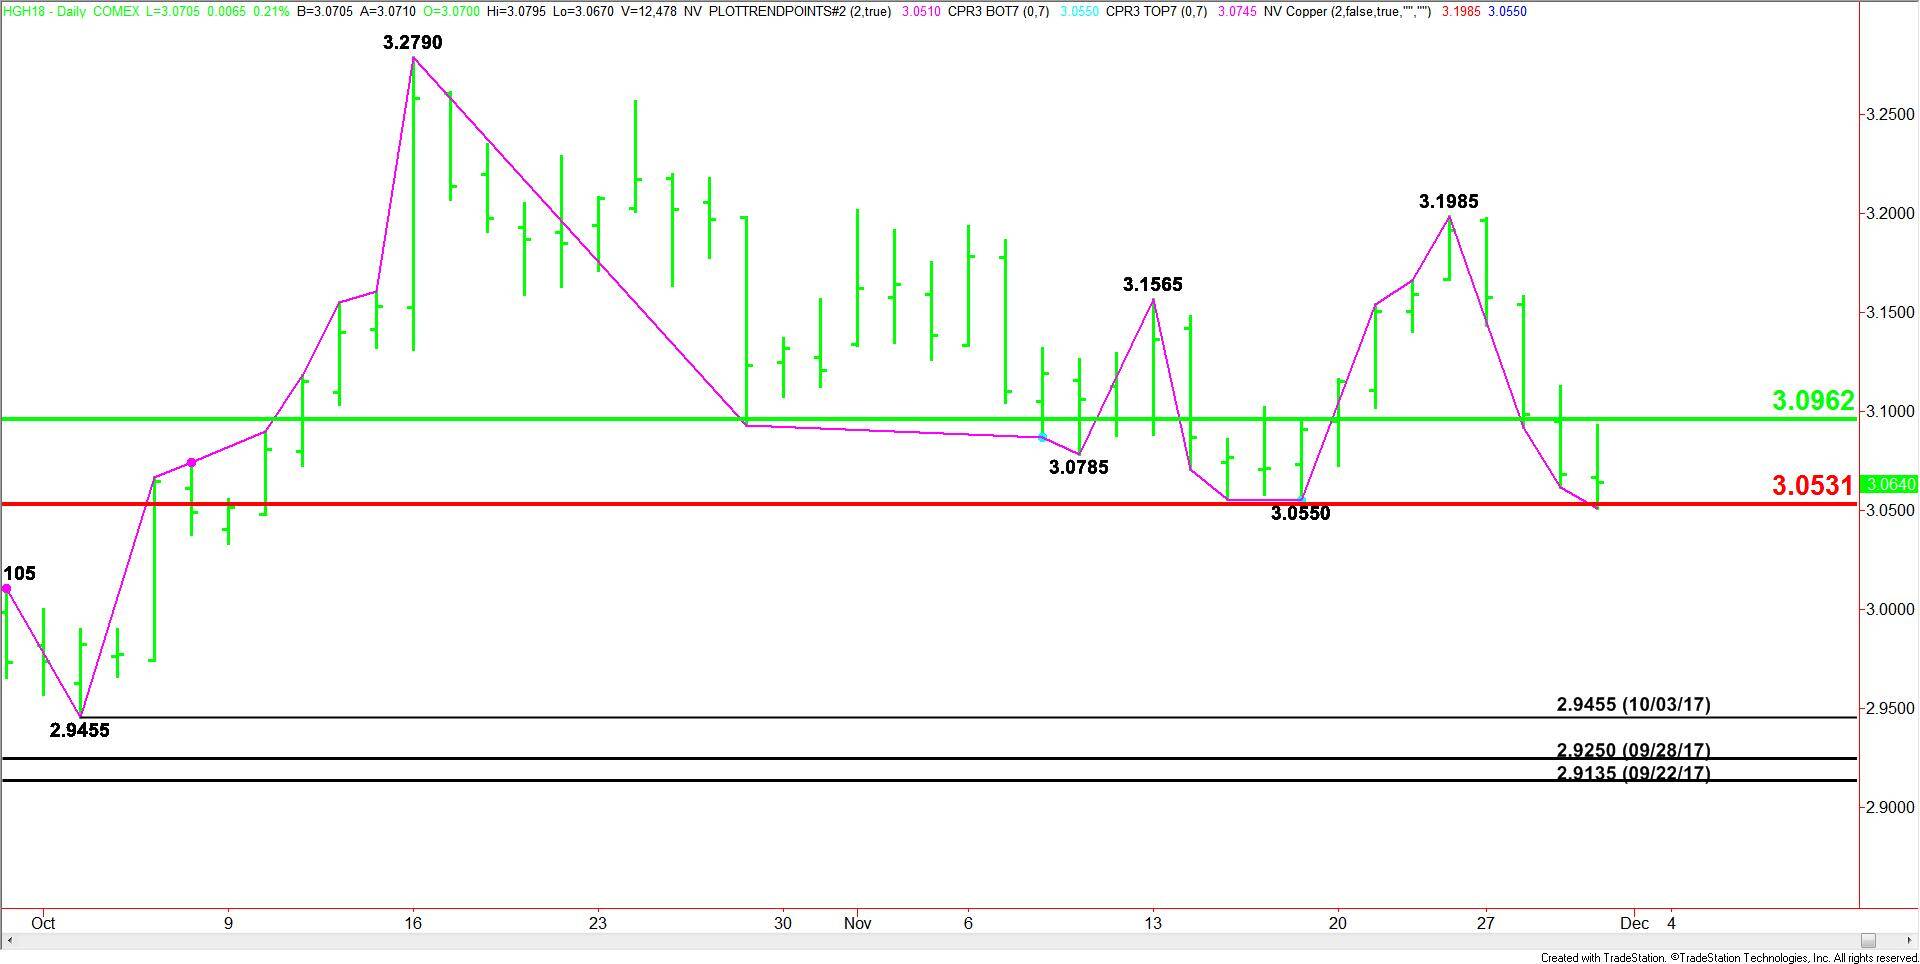
Daily Swing Chart Analysis
The main trend turned down according to the daily swing chart on a trade through the November 17 swing bottom at $3.0550. The move also negated a closing price reversal top. The daily chart indicates there is plenty of room to the downside with the next potential target the October 3 main bottom at $2.9455.
The main range is $2.9455 to $3.2790. Its retracement zone at $3.0960 to $3.0530 is currently being tested. This zone is currently controlling the longer-term direction of the copper market.
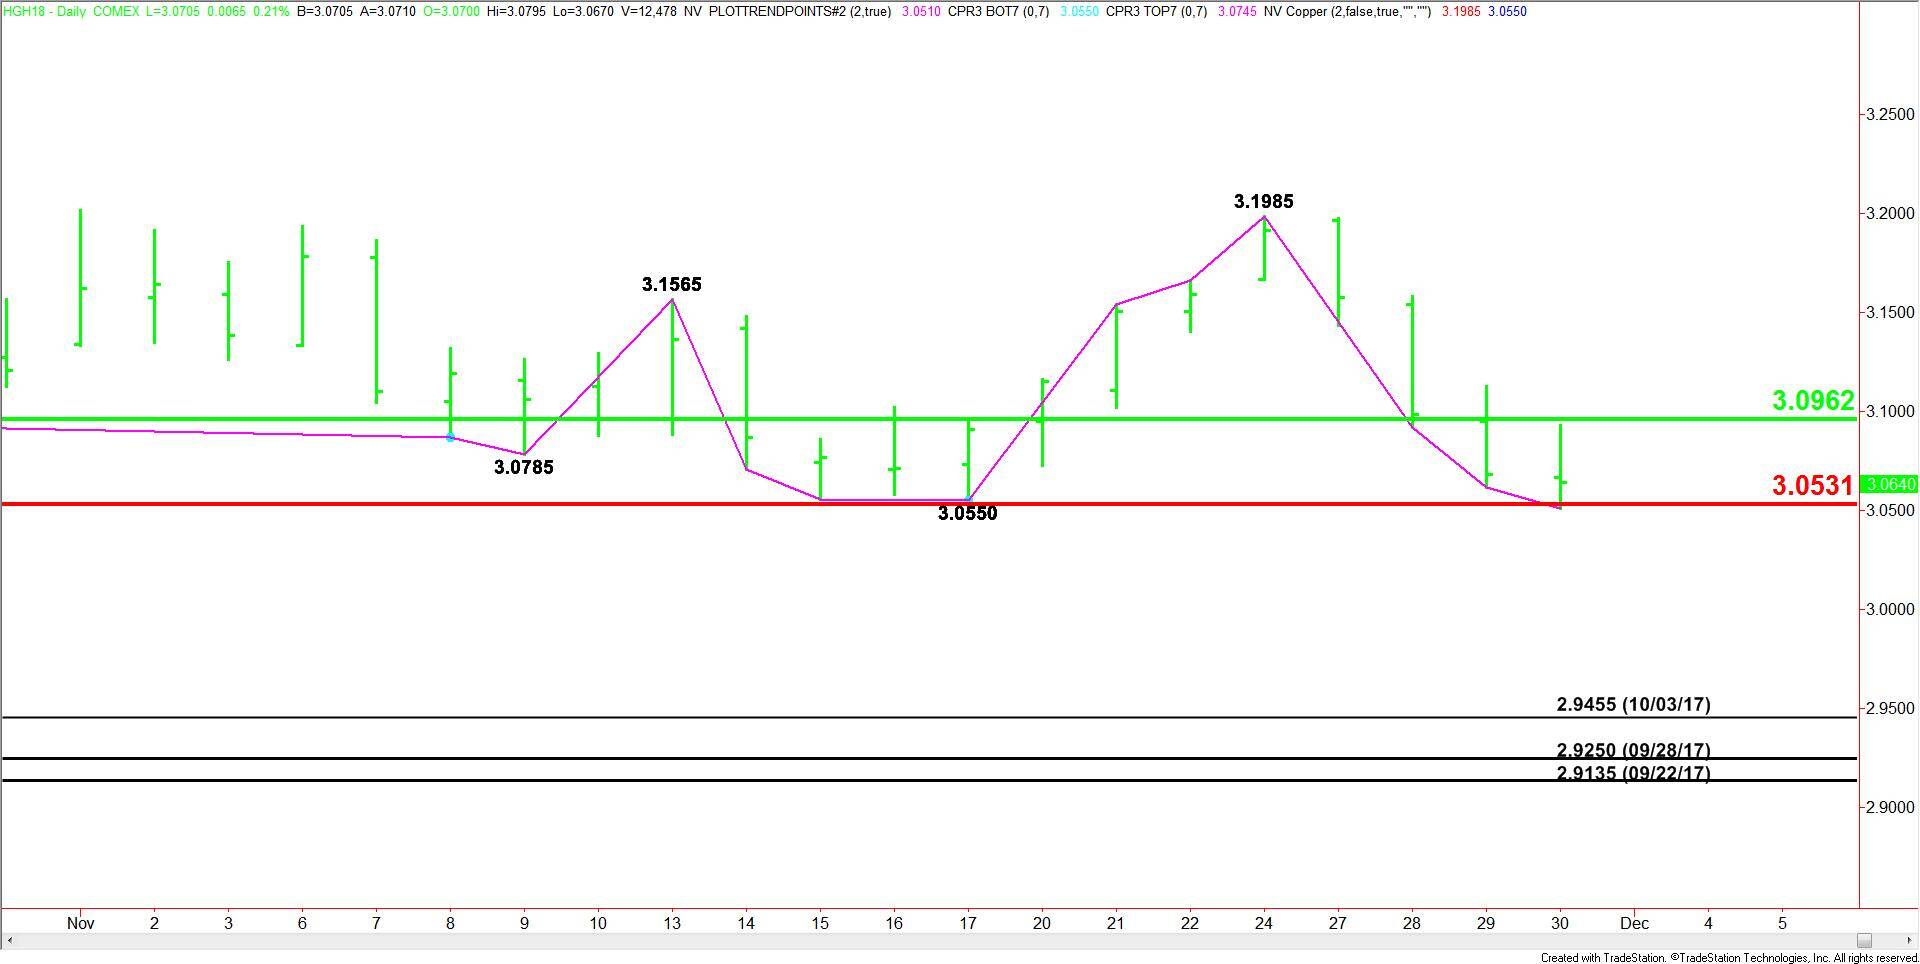
Daily Swing Chart Forecast
Based on Thursday’s close at $3.0640 and the price action, the direction of the copper market on Friday is likely to be determined by trader reaction to the main Fibonacci level at $3.0530.
A sustained move under $3.0530 will indicate the presence of sellers. This could trigger the start of an acceleration to the downside with potential downside targets lined up at $2.9455, $2.9250 and $2.9135.
A sustained move over $3.0530 will signal the presence of buyers. This could trigger a quick retest of the 50% level at $3.0960. Overtaking this level will indicate the buying is getting stronger.