



Copper (XCU) prices rebounded on Monday after the huge sell-off on Friday due to concerns about AI spending. The market is worried about whether the huge spending on AI can generate enough profits. This is important for copper because copper is used heavily in development of data centers and power networks.
Another risk in the copper market comes from expectations of high interest rates. The high cost of borrowing may slow construction of industrial facilities and slow demand for copper. This suggests that copper is still vulnerable to these risks and any rebound in copper might be limited until the price breaks higher.
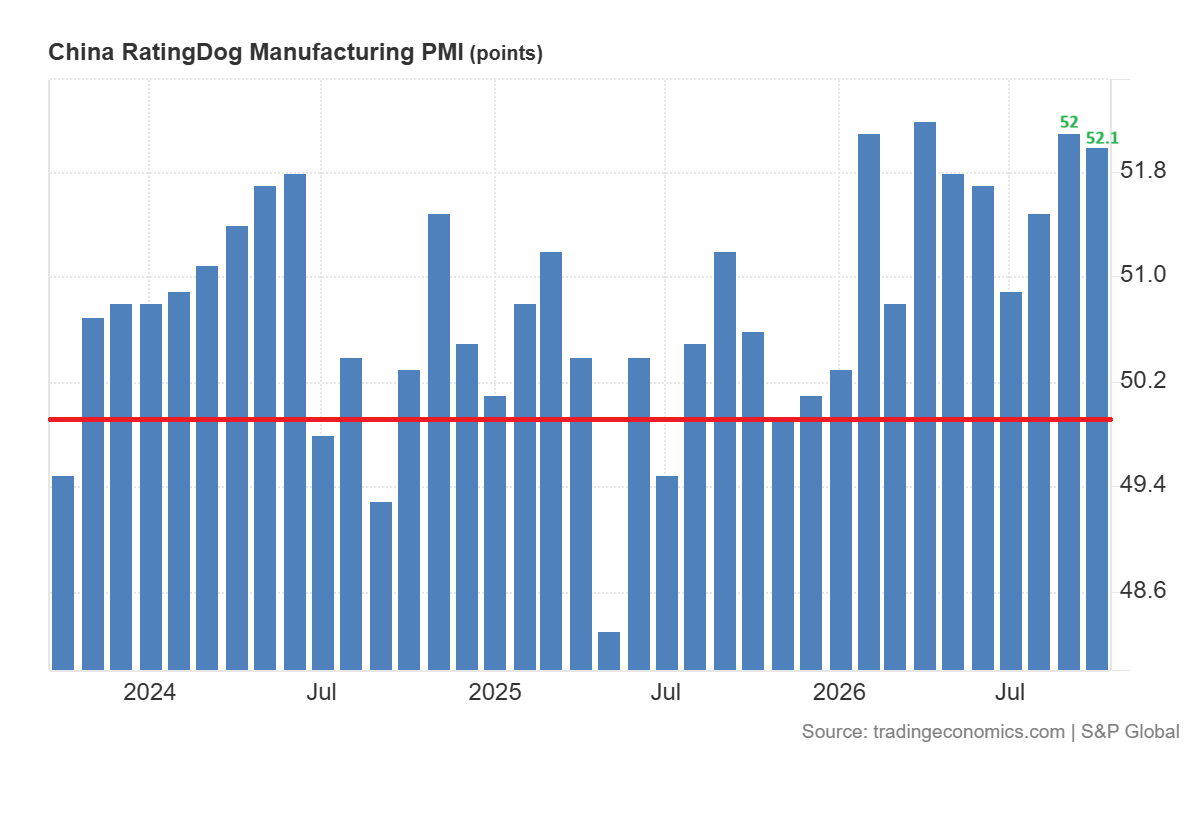
The chart below shows that the private manufacturing PMI for China eased to 52 in October from 52.1 in September.
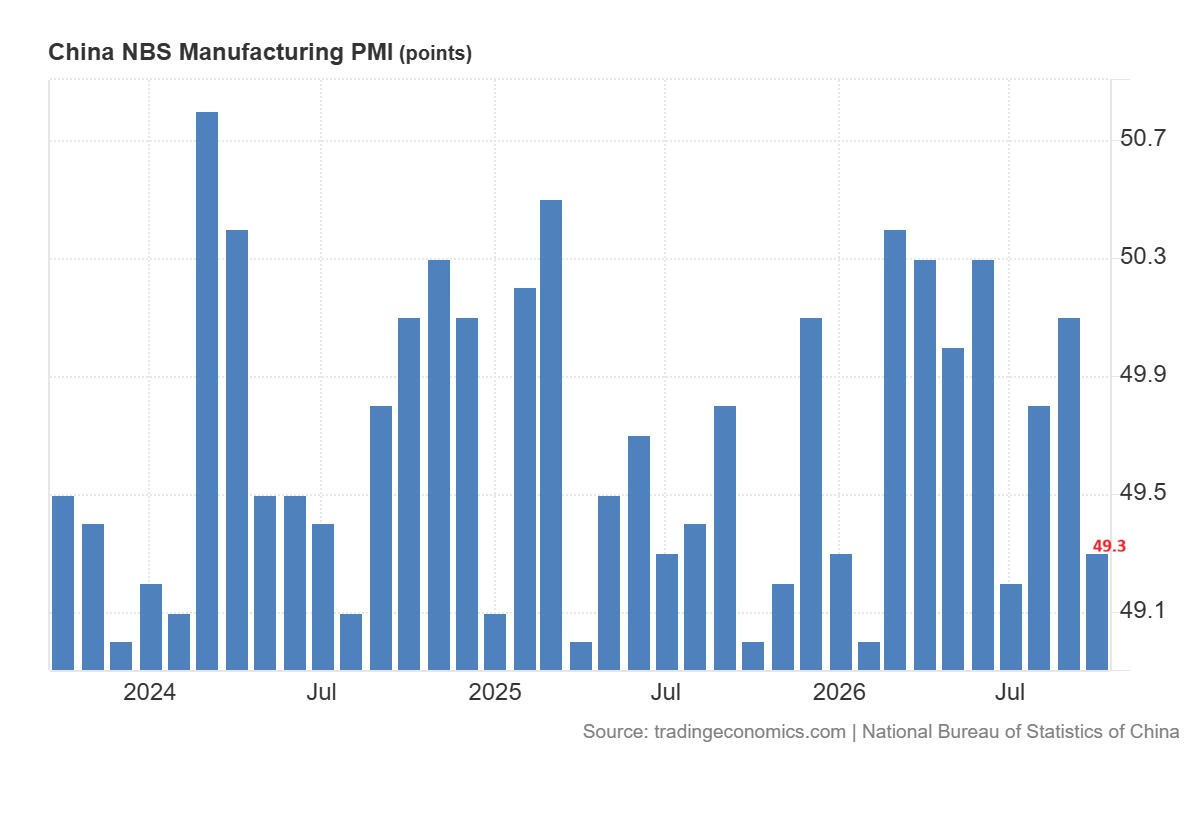
But the China NBS manufacturing PMI dropped to 49.2 in October.
I think that the pressure is building from the high inflation environment in the medium term. But the development in AI projects will likely result in more demand for copper as the metal is used heavily in AI construction.
Copper Price Forecast: $6.95 Breakout Could Lead to Higher Prices
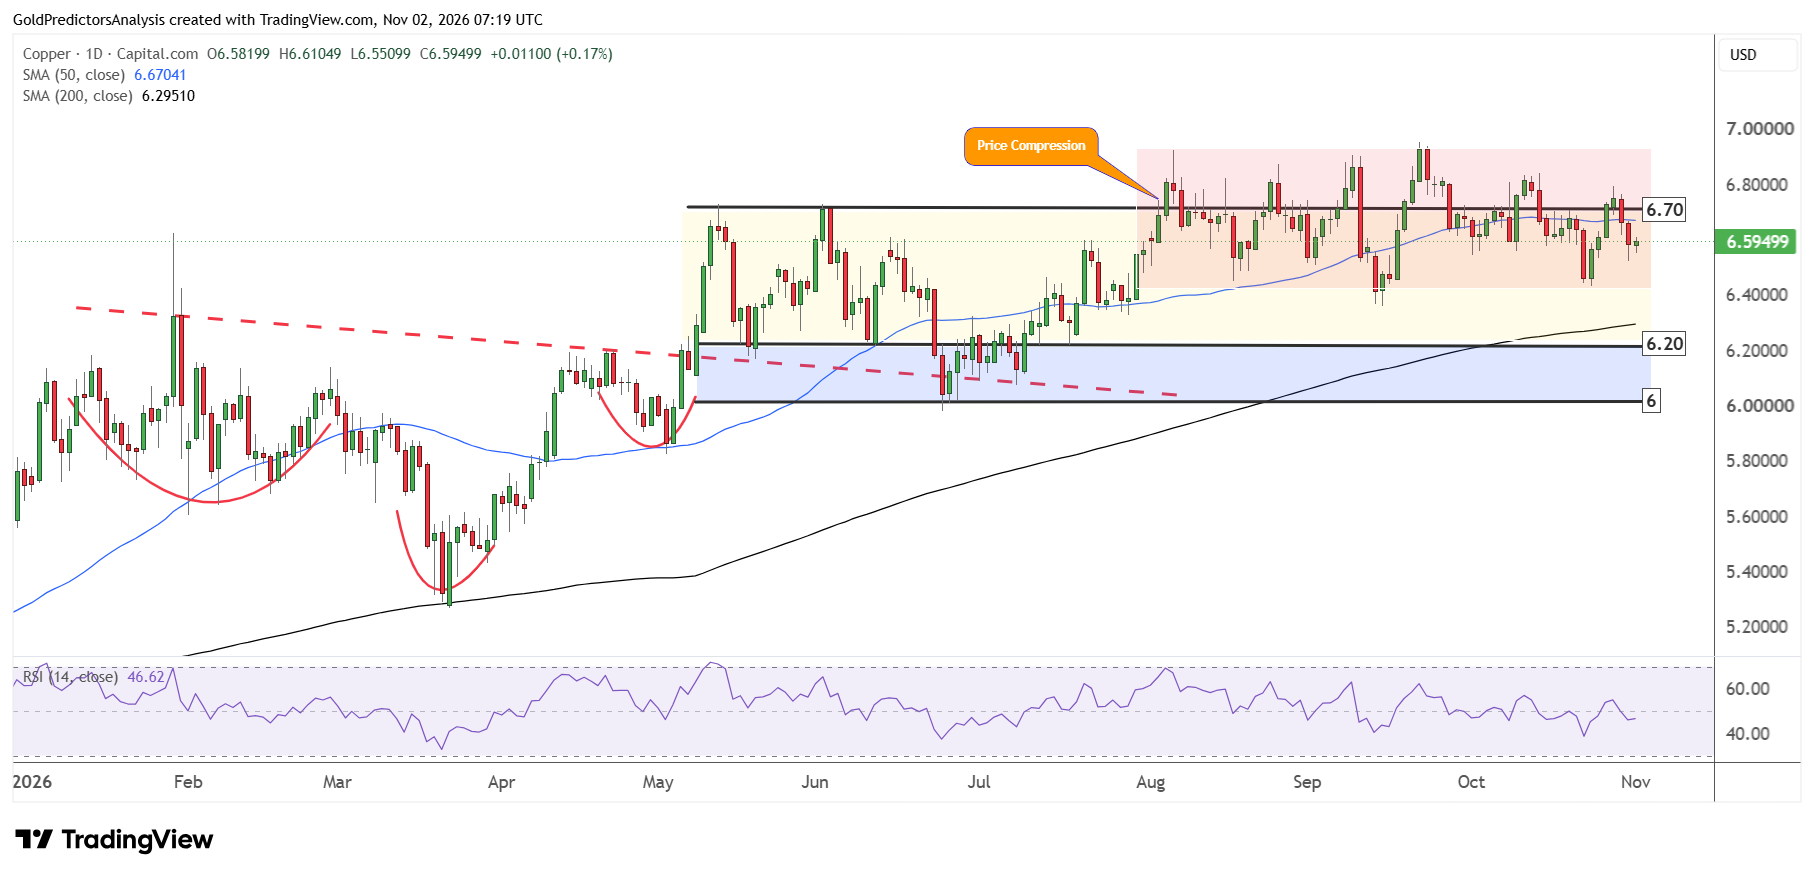
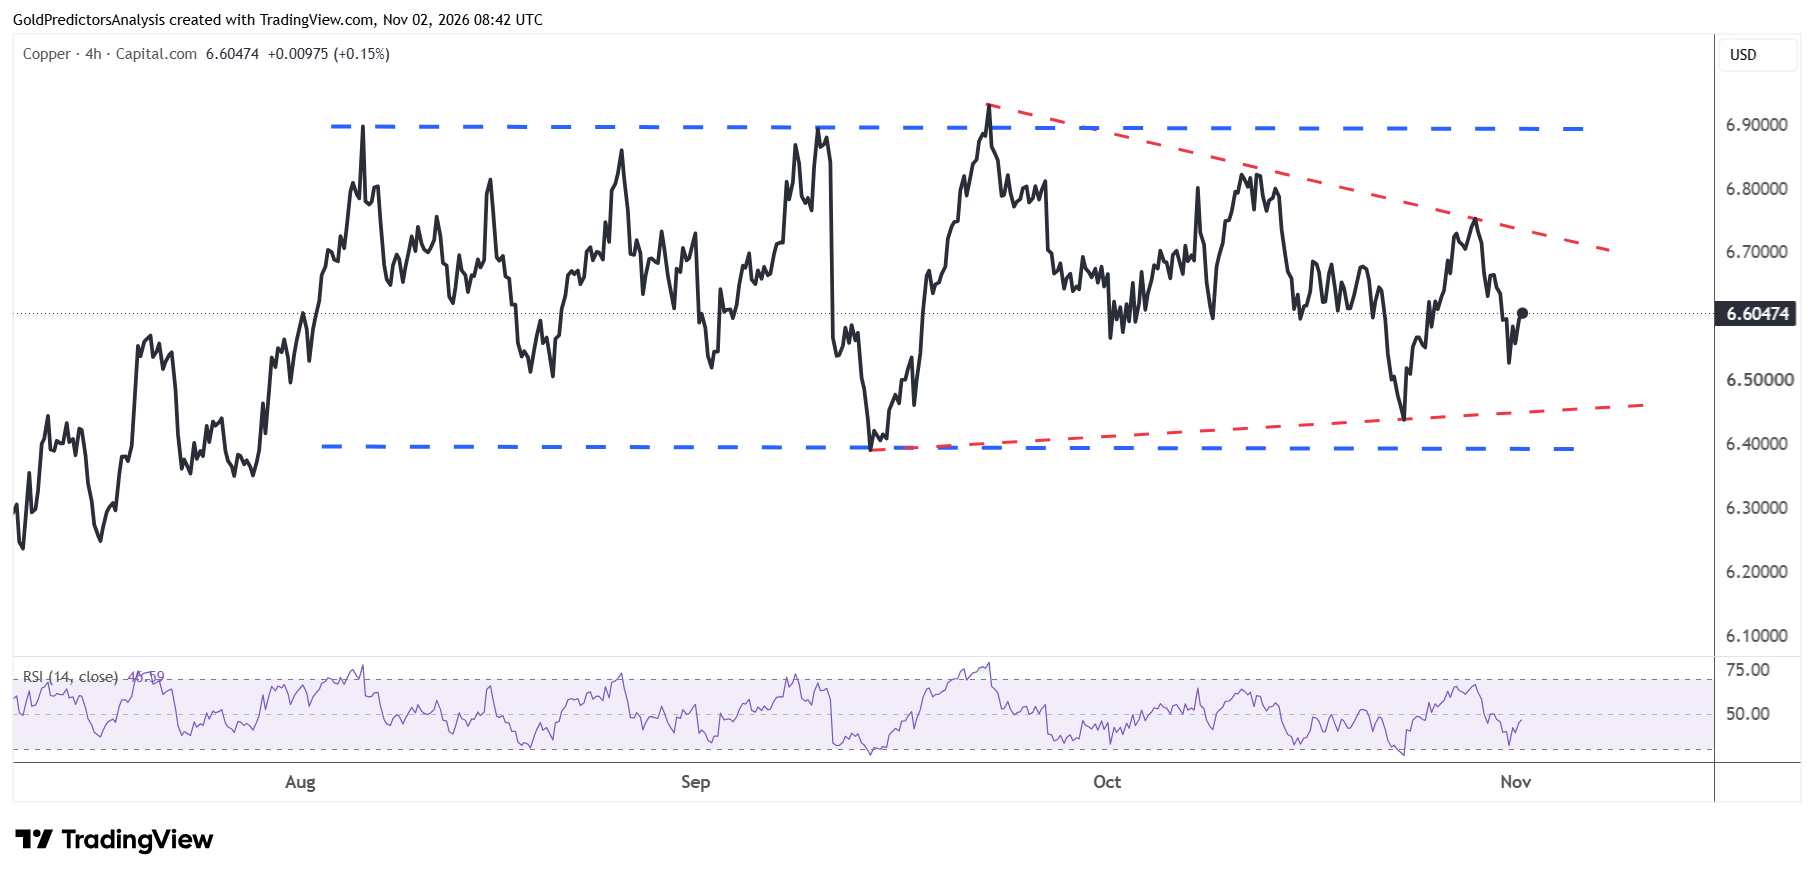
The daily chart for copper shows that the price has been consolidating between the $6.95 and $6.40 levels since August 2026. A break above $6.95 may open the way for strong rally in the copper market.
However, a break below $6.40 may push the copper price towards the $6.20 level, which is defined by the 200-day SMA. As long as the copper price remains above $6, the possibility of another rally towards the $7.50 level remains high.
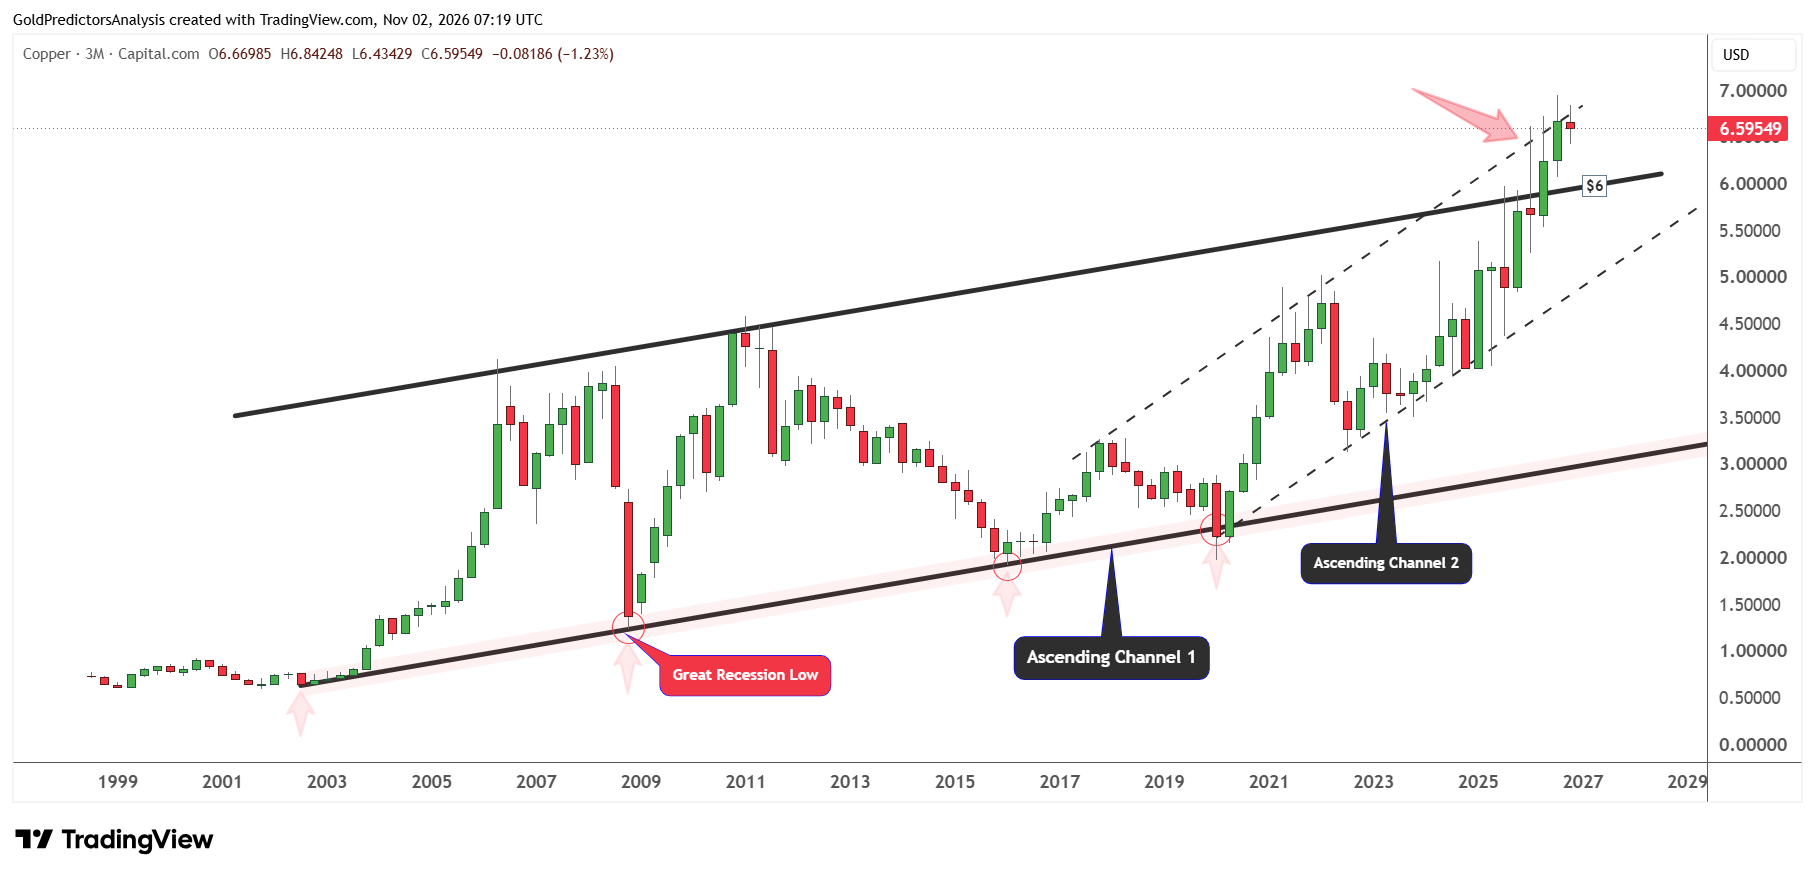
This rally may be driven by the heavy construction of AI data centers, where copper is used as industrial metal. Despite this strong bullish outlook, the quarterly chart shows that the price consolidates near the strong resistance area.
However, price must hold $6, which is defined by the support of the ascending channel pattern. The price gained 6.84% in Q3 and is waiting for the next move. A break above $6.90 is required to push the price higher.
These consolidations are also observed on the 4-hour chart, where the price is looking for the next direction. The red-dotted trend lines suggest that the price range in copper might be thinning in the short term.
Copper Price Forecast
Every new Copper analysis as it publishes, today's technical signal and key levels, live price — on one page.
See all Copper forecastsCopper Outperforms Gold and Silver as Ratios Rise
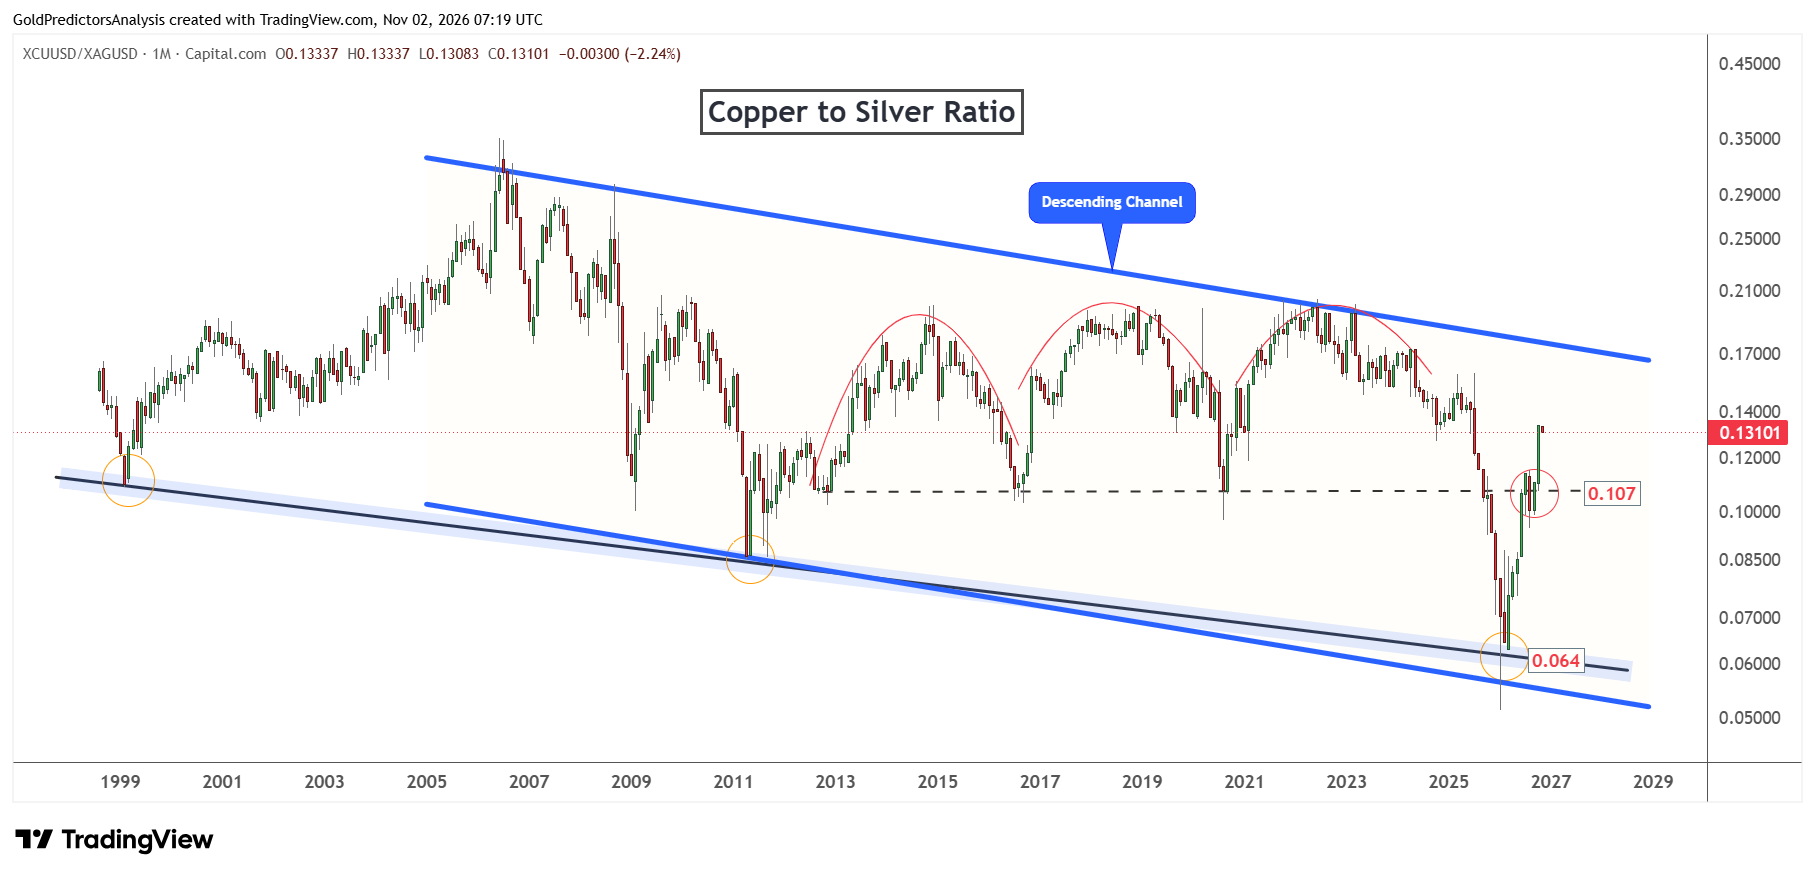
Despite the strong consolidation between the $6.40 and $6.95 levels in copper, the price shows relative strength compared to silver (XAG) and gold (XAU). This outperformance is observed in the copper-to-silver ratio which shows that the ratio has broken above 0.107 after forming low near the support of 0.064.
The ratio gained 21.22% in October, which suggests that it may continue to move higher toward the 0.1580 level. Once the ratio produces a high, it may suggest the case for a bottom in the silver market.
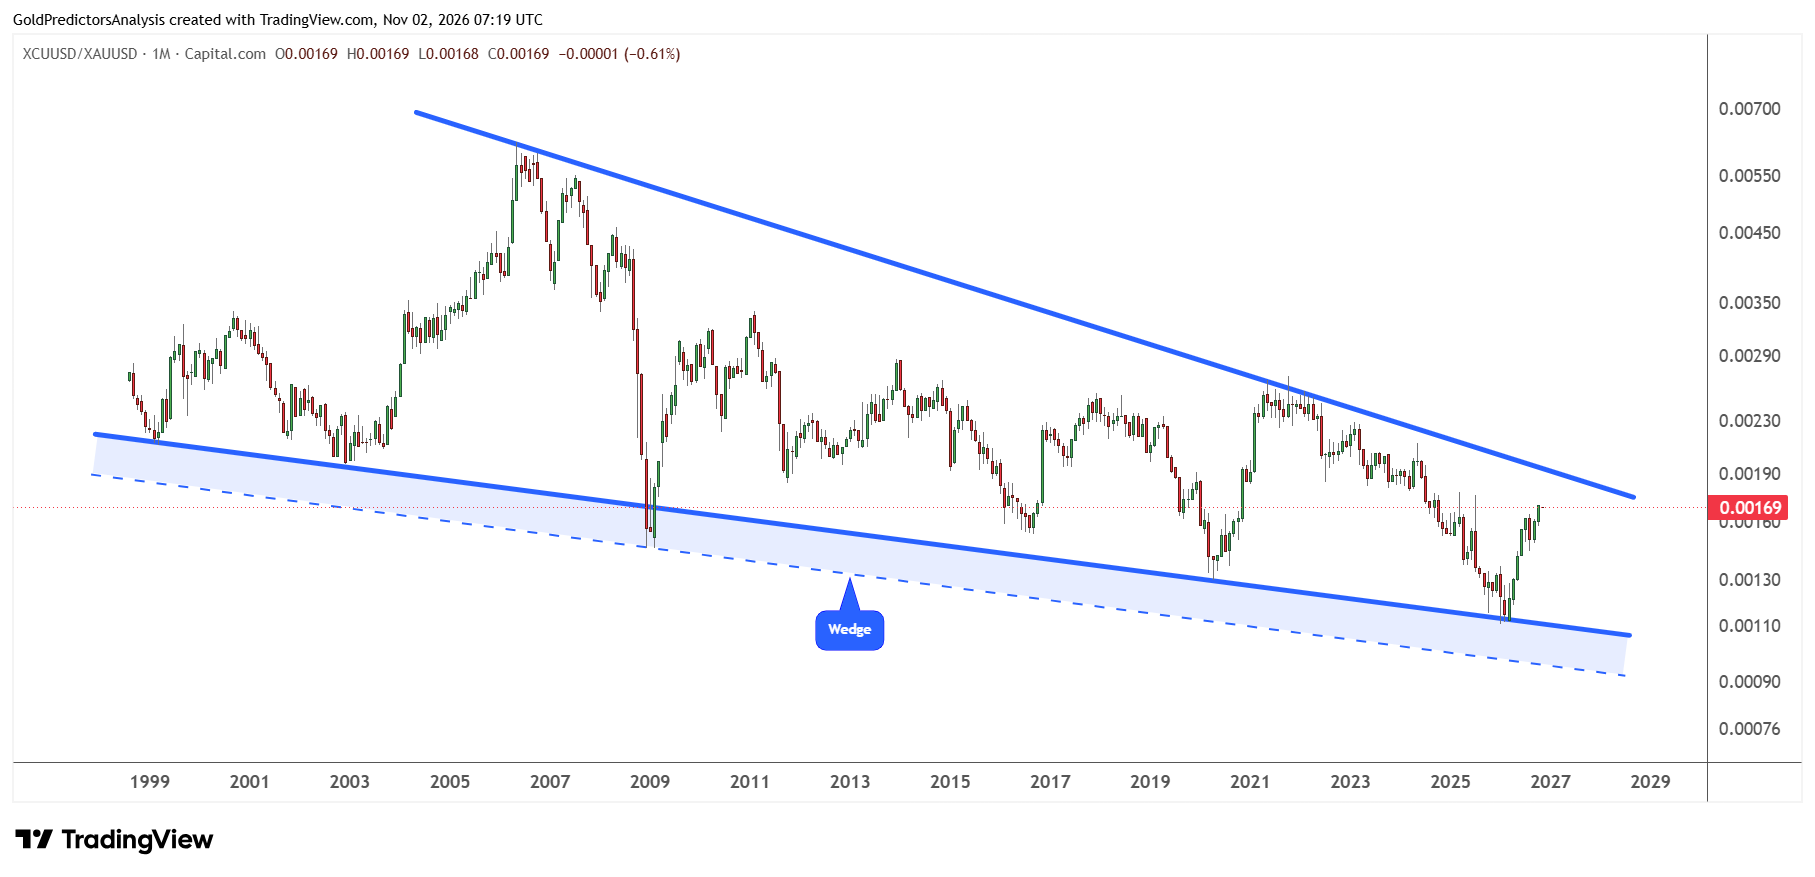
Similarly, the copper-to-gold ratio shows that the ratio has formed support at 0.0011 and continues to accelerate higher. The long-term resistance in the ratio remains at 0.0019. A break above this level will break the wedge pattern. But if a peak forms near the resistance area, it may suggest the case for a bottom in the gold price.
What to Watch Next
The huge technology selloff on Friday triggered a short term correction in copper prices. However, copper still remains in consolidation between the $6.40 and $6.95 levels during the past three months. The AI projects may support the demand for copper. But the high cost of borrowing and high inflation environment create risk for copper. In my view, copper needs to break above $6.95 to open the way for further upside. However, a break below $6.40 may push the copper price to the $6-$6.20 range.
Read more: Tech Sell-Off Raises Risk of a Drop to $45 in Silver