


Silver (XAG) prices came under pressure and dropped 8.84% last week as technology stocks sold off. The high oil prices also increased fears of inflation and may keep interest rates high. But the heavy AI spending plans by companies may create strong demand for silver for computing hardware and power systems. For now, silver remains under pressure in the short term and is testing the key support at $48-$50. In my view, the selling pressure may continue to push prices further lower in the short term. This article presents main drivers of silver and key levels to understand the next direction for silver price.
Tech Sell-Off Adds to Short-Term Pressure on Silver
Technology stocks were hit by disappointing quarterly earnings and outlooks. The chart below shows that major technology and AI stocks dropped significantly during the month.
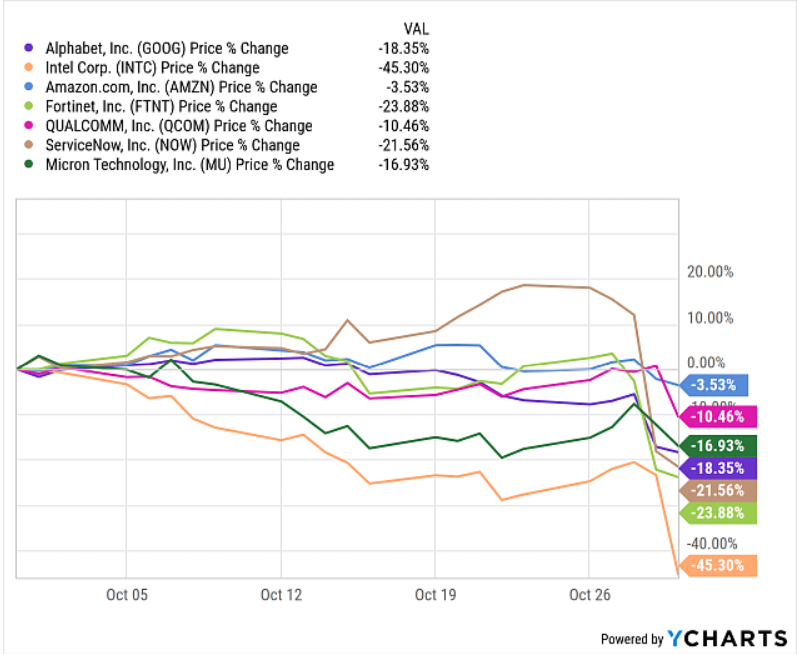
It is observed that Intel Corp. (INTC) has lost 45.3% during the past 30 days. On the other hand, Fortinet Inc. (FTNT) lost 23.88%. Moreover, Alphabet, Inc (GOOG), Amazon, Inc (AMZN), Qualcomm Inc. (QCOM), ServiceNow Inc. (NOW), and Micron Technology, Inc (MU) lost 18.35%, 3.53%, 10.46%, 21.56% and 16.93%, respectively.
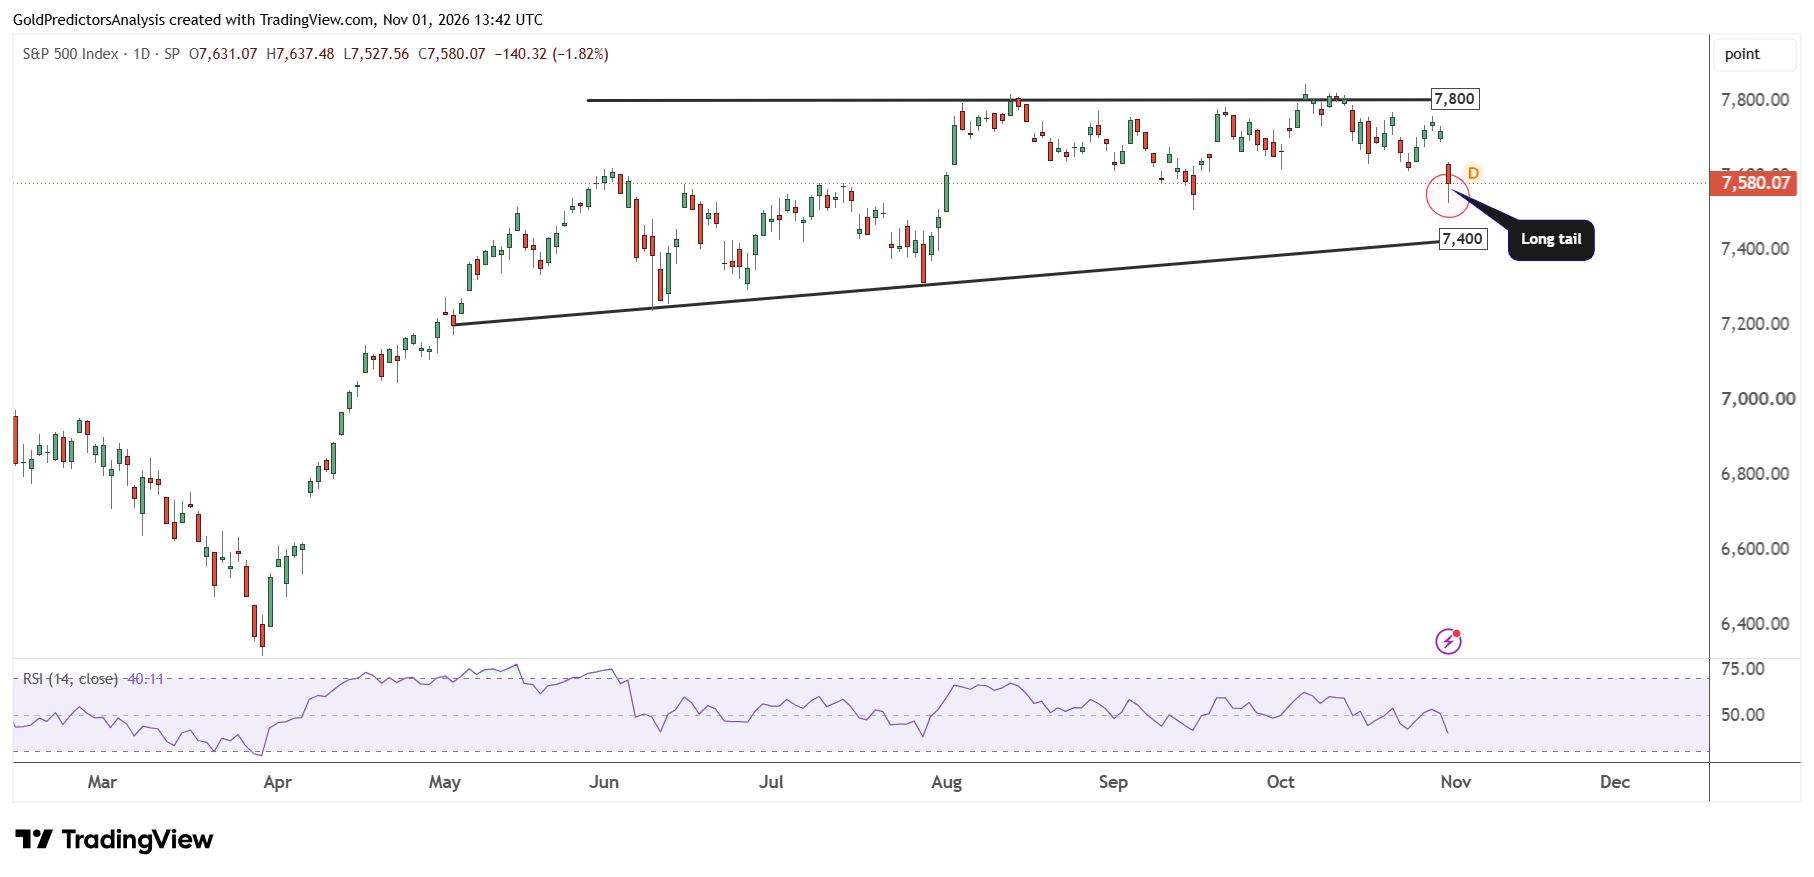
The S&P 500 also lost 1.82% on Friday due to the heavy sell-off in technology stocks. But the long tailed candle for Friday suggests that new buyers are entering the market. However, the S&P 500 still remains above the 7,400 level which suggests that the index still remains between the 7,400 and 7,800 range despite this weakness.
The Nasdaq 100 also got hit by technology stocks as QQQ broke support at the 700 level which signals further downside during the next few days.
The Philadelphia Semiconductor Index has dropped significantly during the week after marking a high at 11,731 and closed below the key level of 11,000. This suggests that the semiconductor stocks may face the risk of further downside during the next week.
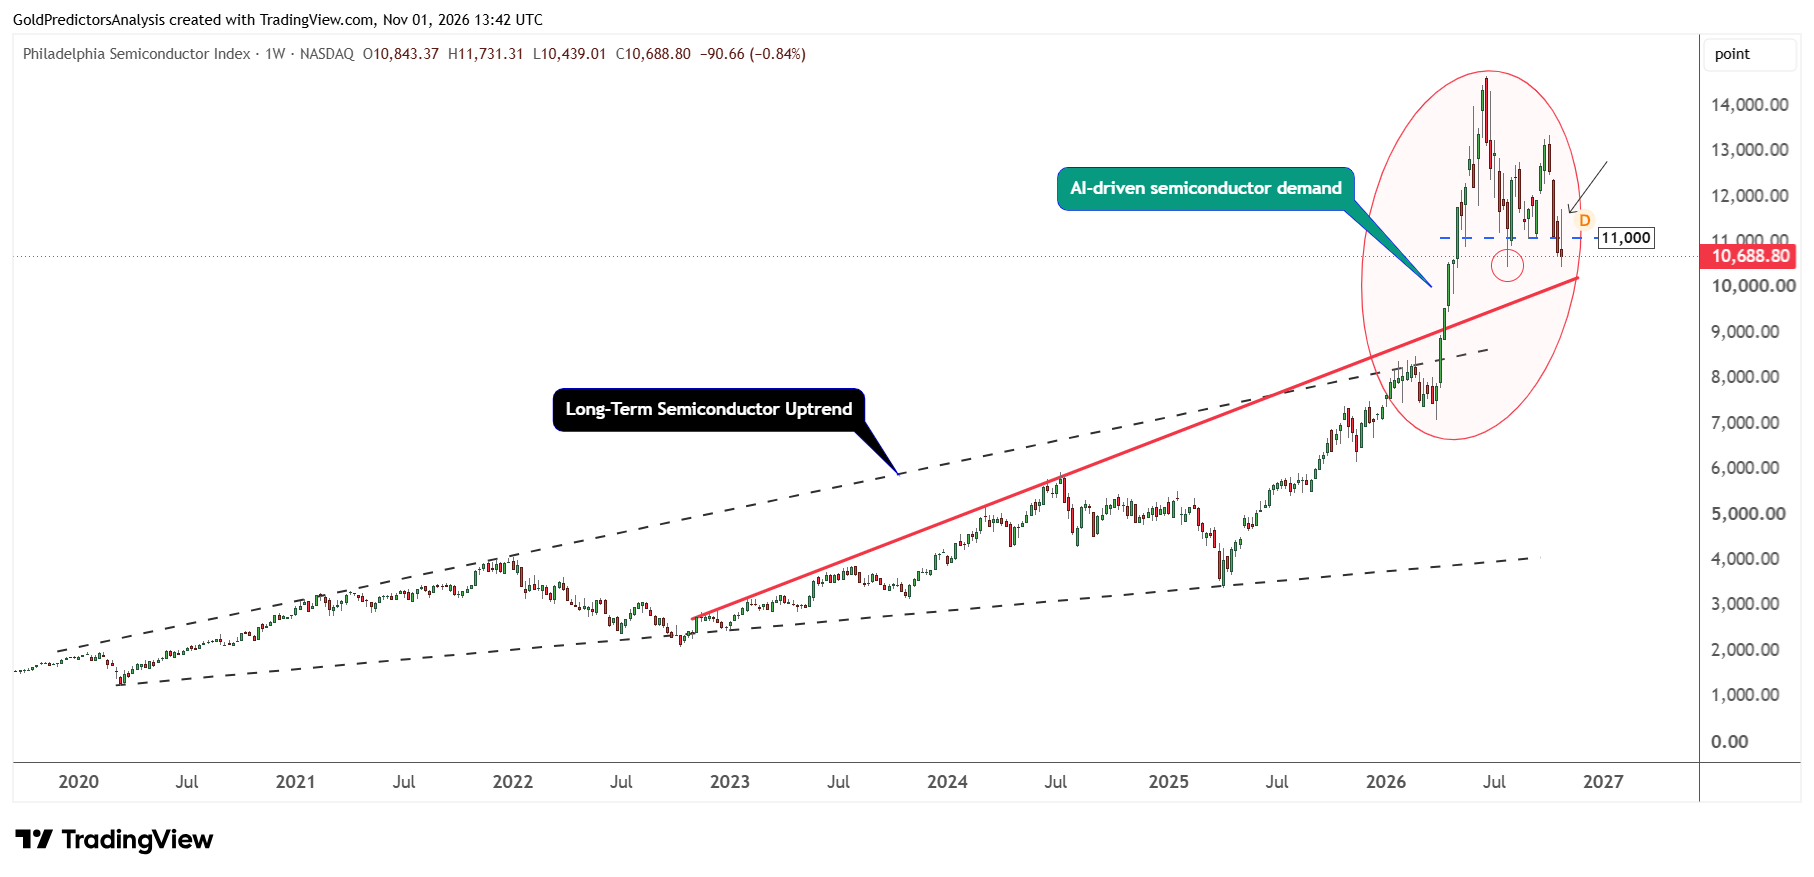
The immediate support now remains at the 10,200 level. This support is defined by the ascending trend line that stretches from November 2024 highs. This suggests that semiconductor stocks may further weaken during the next few days.
Silver Price Forecast
Every new Silver analysis as it publishes, today's technical signal and key levels, live price — on one page.
See all Silver forecastsTreasury Yields Fall Below 5% as Investors Turn to Bonds
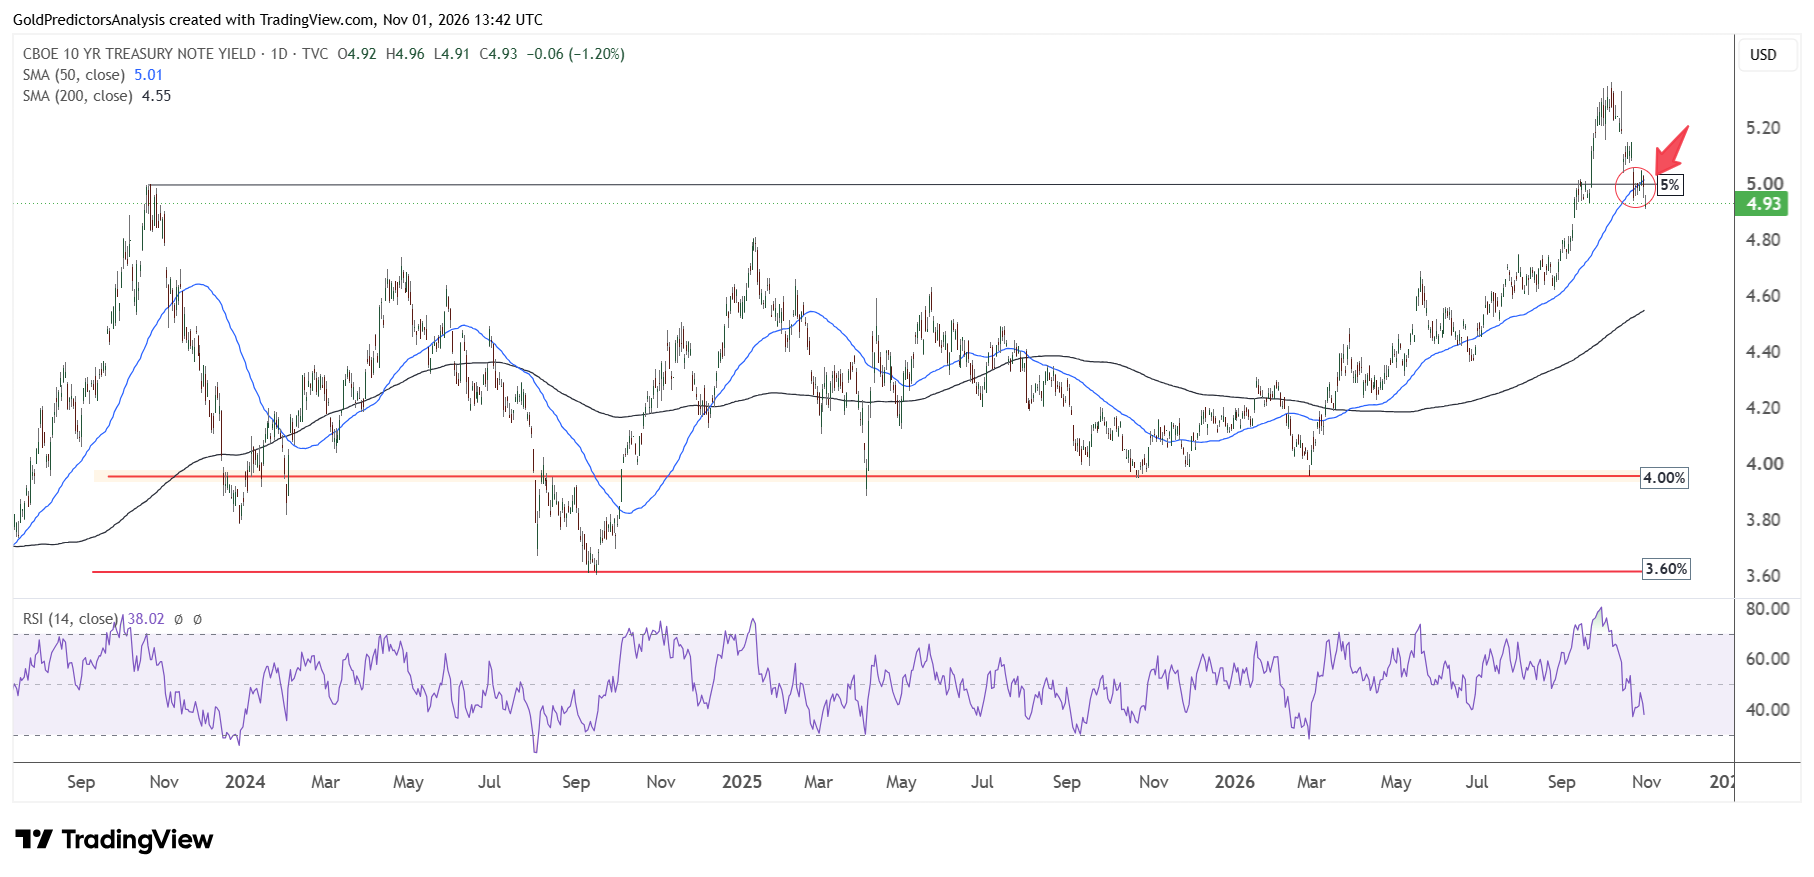
The weakness in technology stocks has pushed funds from stocks to the relative security of bonds. This transfer of funds has triggered decline in the 10-year Treasury yield. This pushed the 10-year Treasury yield below the 5% level as seen in the chart below.
The close at 4.93% for the week has broken below the 50-day SMA. This suggests that the 10-year Treasury yield may drop further towards 4.75%-4.80% which is the immediate support. Any recovery above 5.05% may indicate further upside.
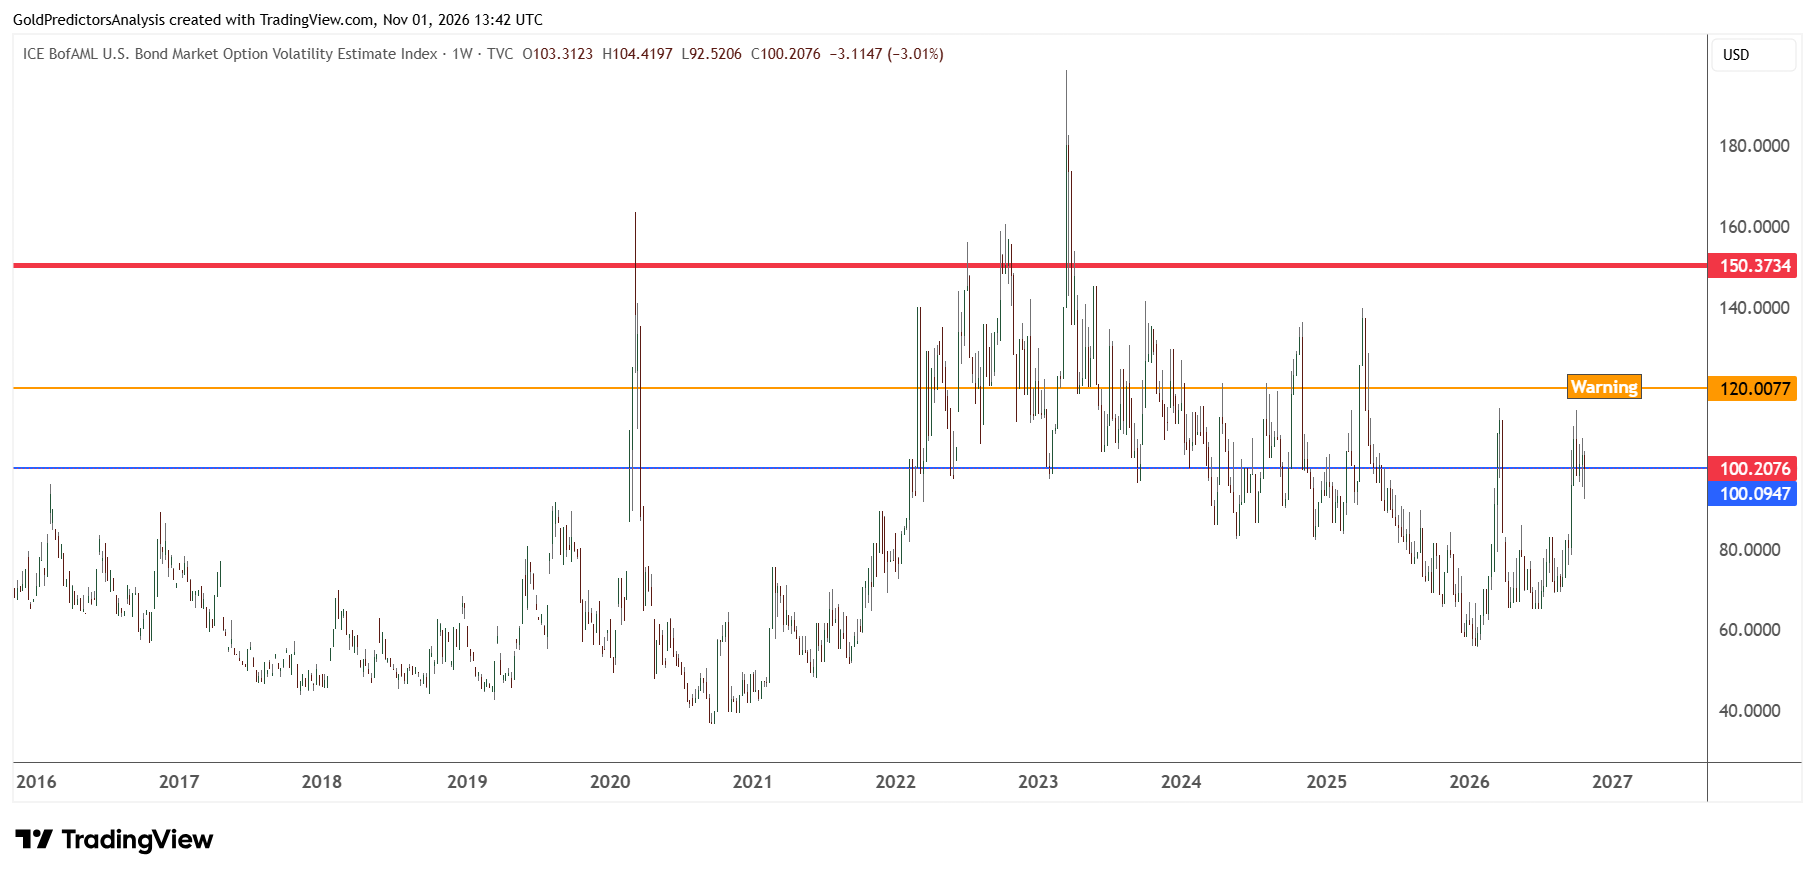
The MOVE index has rallied to 100 after marking a low at the 92.52 level during the week. This rebound suggests warning of tighter liquidity. Despite this strain, the MOVE index still remains below the 120 level, which is considered a warning level.
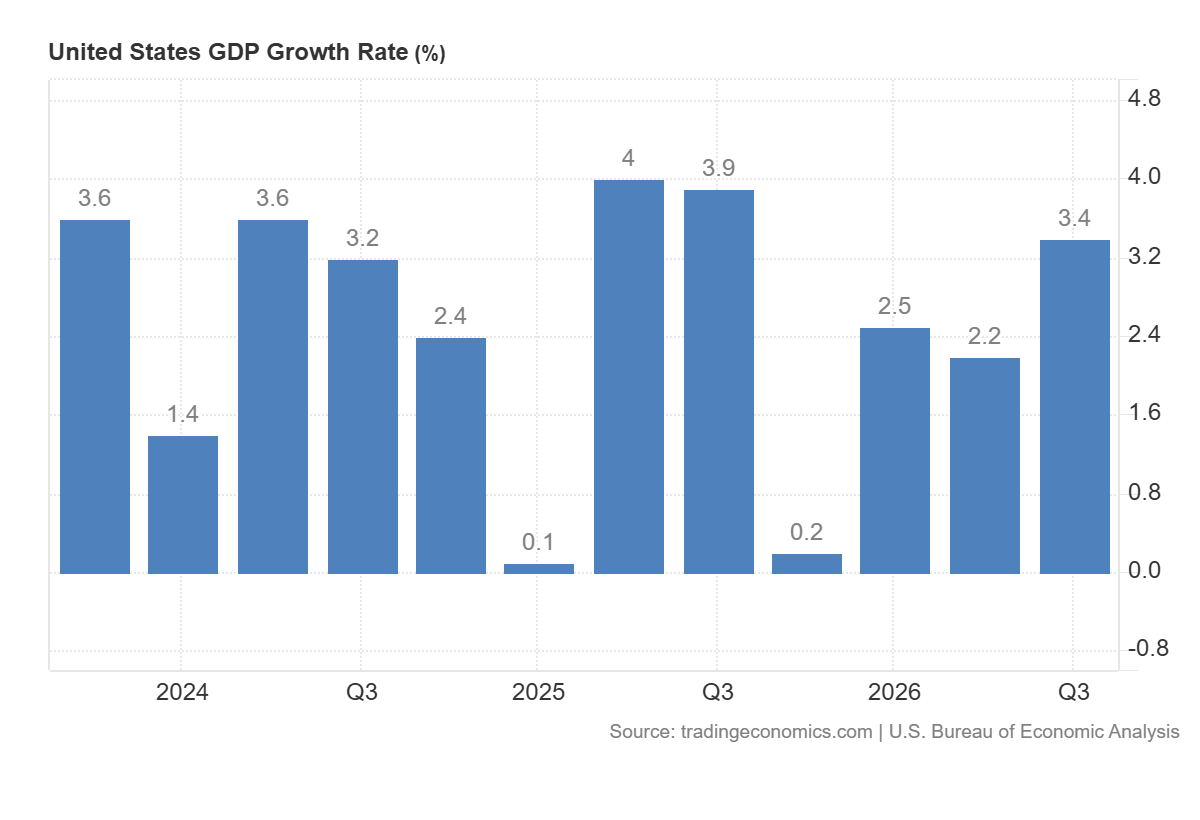
Real GDP has increased at an annualized rate of 3.4% in Q3 above the expected 3.2%. The GDP implicit price deflator rose at annualized rate of 2.2%.
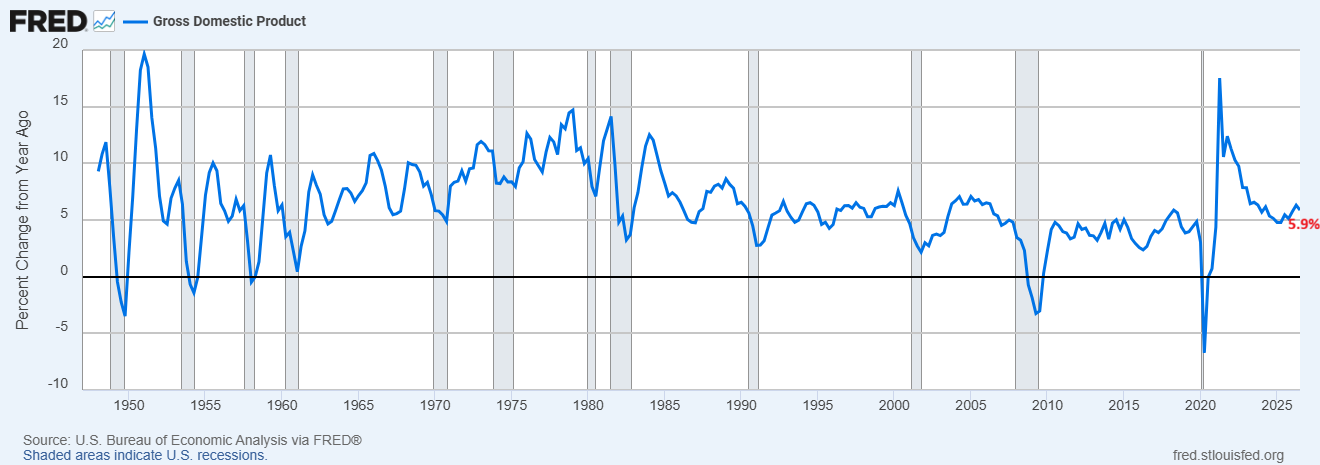
The nominal GDP growth has remained at 5.9% for the 12 months to September and aligns with the strong economic expansion.
Higher Oil Prices Keep Inflation Risks High
The key risk in the precious metals market still remains the high inflation environment. The escalation of tensions in Middle East has driven crude oil prices near key resistance levels. A break above $120 in Brent oil may push oil higher.
The high cost of energy is lifting inflation higher. The chart below shows that headline PCE inflation has jumped to 3.6% for 12 months to September. This is up from 3.4% in August. The core PCE inflation increased to 3.1% from 3.0% in August.
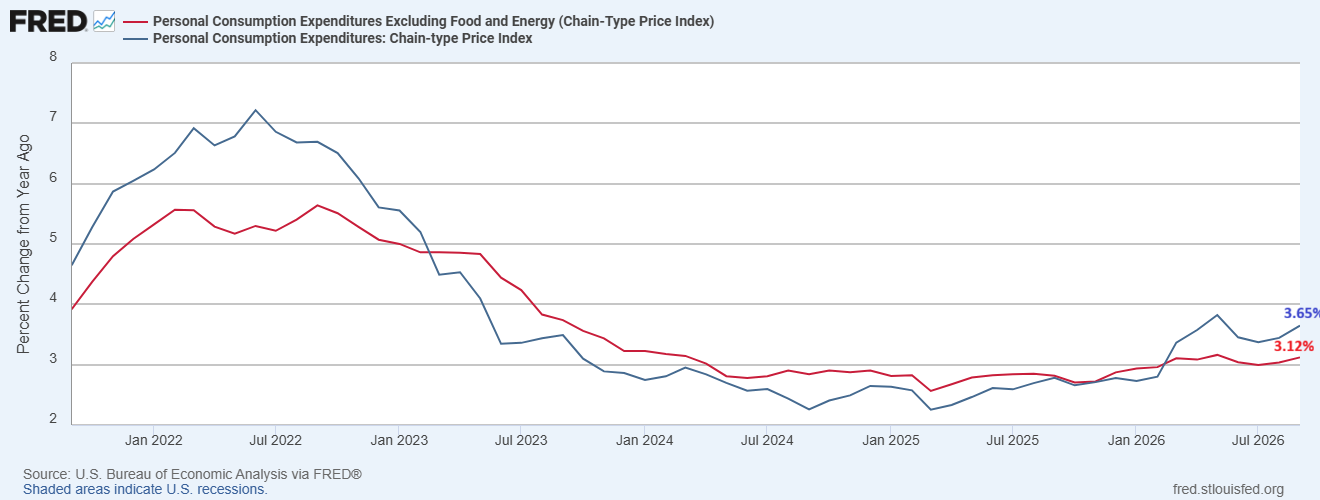
The high energy prices may likely impact core PCE inflation within the few weeks. This suggests that core PCE inflation may go even higher in next few weeks.
AI Spending Could Support Long-Term Silver Demand
As discussed above, technology stocks continue to drop significantly, which is pushing the major stock indexes down. This is creating risk for silver prices in the short term as the price continues to drop below key support levels.
However, this breakdown does not change the long-term demand for silver. Silver is used heavily in computer hardware and power systems. Since companies continue to spend heavily on AI, this will likely attract new buyers at lower levels, which may push silver prices higher again. Therefore, the recent correction in silver prices may be an attractive opportunity for long-term investors.
Silver Price Forecast: Key Support Levels and Recovery Targets
Monthly Chart: Silver Tests Long-Term Support at $45–$50
From a technical perspective, the silver price produced a high in the $120 area in January 2026, which triggered a strong drop. The formation of candles with long shadows in January 2026 and then in May 2026 suggested that prices would likely drop towards lower levels.
In October, the price dropped toward the key support area that I have been discussing during the past few months. This area lies between $45 and $50. The $50 region is defined by the April 2011 highs, while the $45 level is defined by the August 2011 high. Both levels have been the key resistances historically.
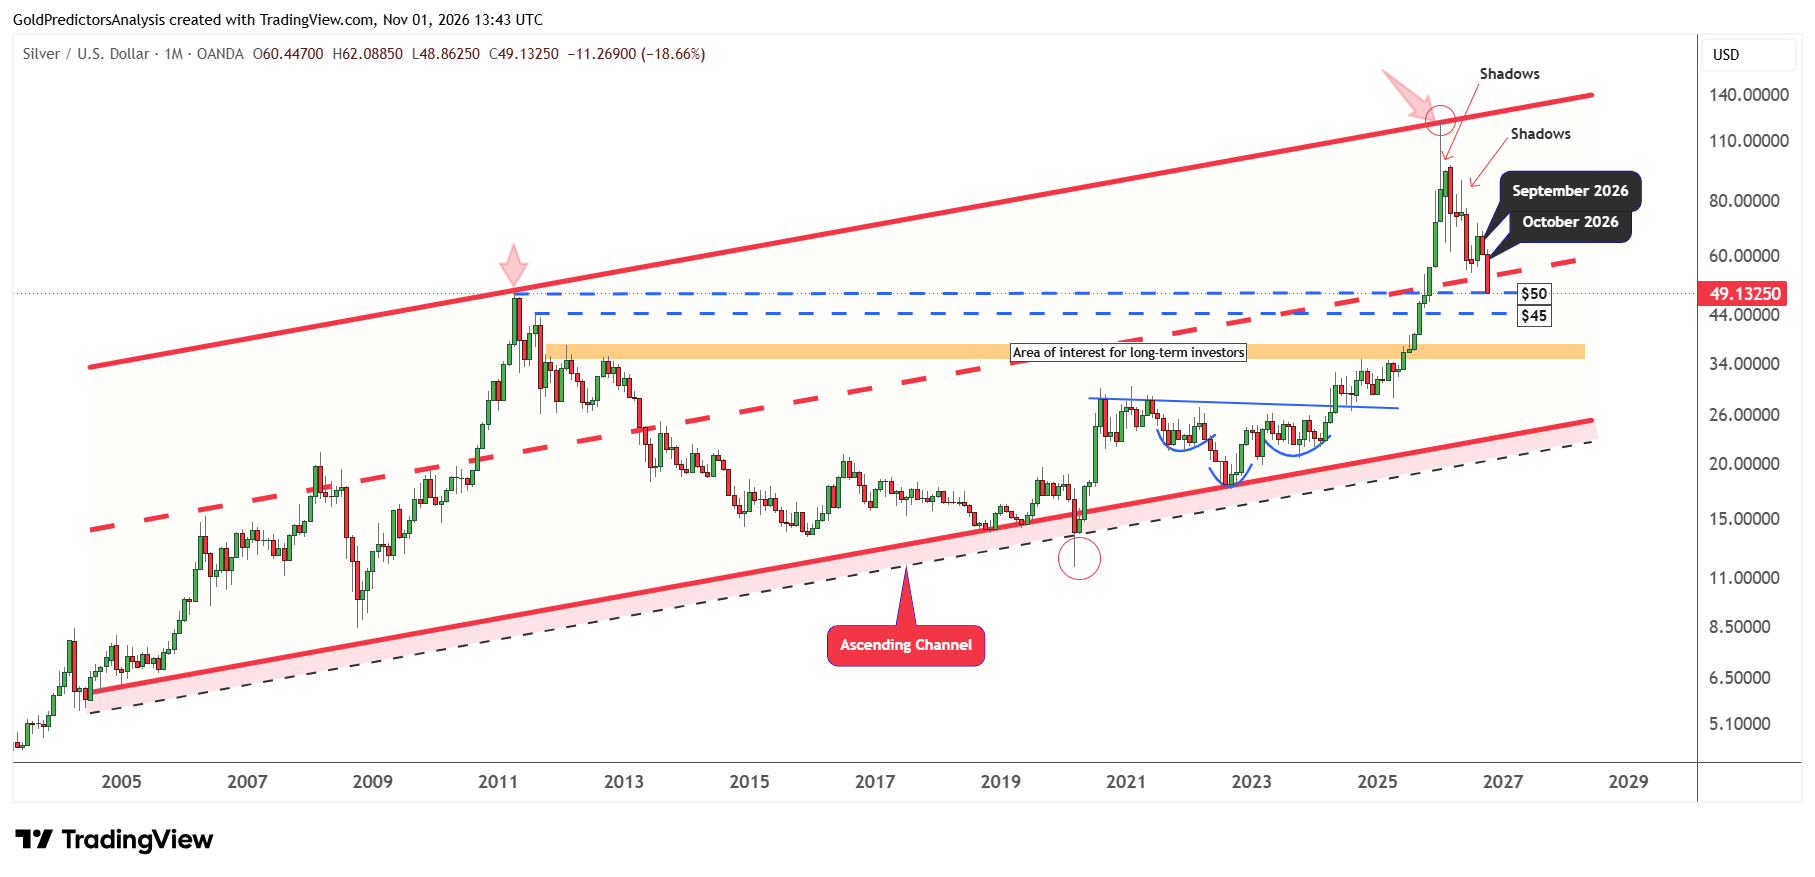
This area is now becoming strong support in the long term, which may provide a low if prices manage to rebound and close above the $60 area. However, the monthly candle for October is strongly negative and suggests that the price may continue to drop in the short term.
However, if prices drop towards the $45 region and rebound higher to close above $60, it will strengthen the possibility of bottom.
But a confirmed break below $45 will likely push prices towards the $35 to $37 region which is defined by the resistance from February 2012 to October 2012. This region will likely be treated as long-term support in the silver market.
Despite the strong drop in silver prices, the overall price structure remains strongly bullish. This bullish structure is formed using the inverted head and shoulders patterns from December 2020 to May 2024.
Weekly Chart: A Recovery Above $55 Could Lift Silver Towards $60
The weekly chart for spot silver also shows strong bearish pressure on silver prices as technology stocks continue to sell off. The price has already reached the lower support line of falling wedge pattern near the $48 to $50 region.
But the weekly candle for silver remains strongly negative. The price has lost 8.84% for the week which suggests that the price may remain under pressure in the short term.
However, if the price drops next week toward the $45 to $46 region, then rebounds to close above the $50 area and produces a candle with a long tail within the falling wedge pattern, it will likely strengthen the possibility of a strong rally toward the $60 area.
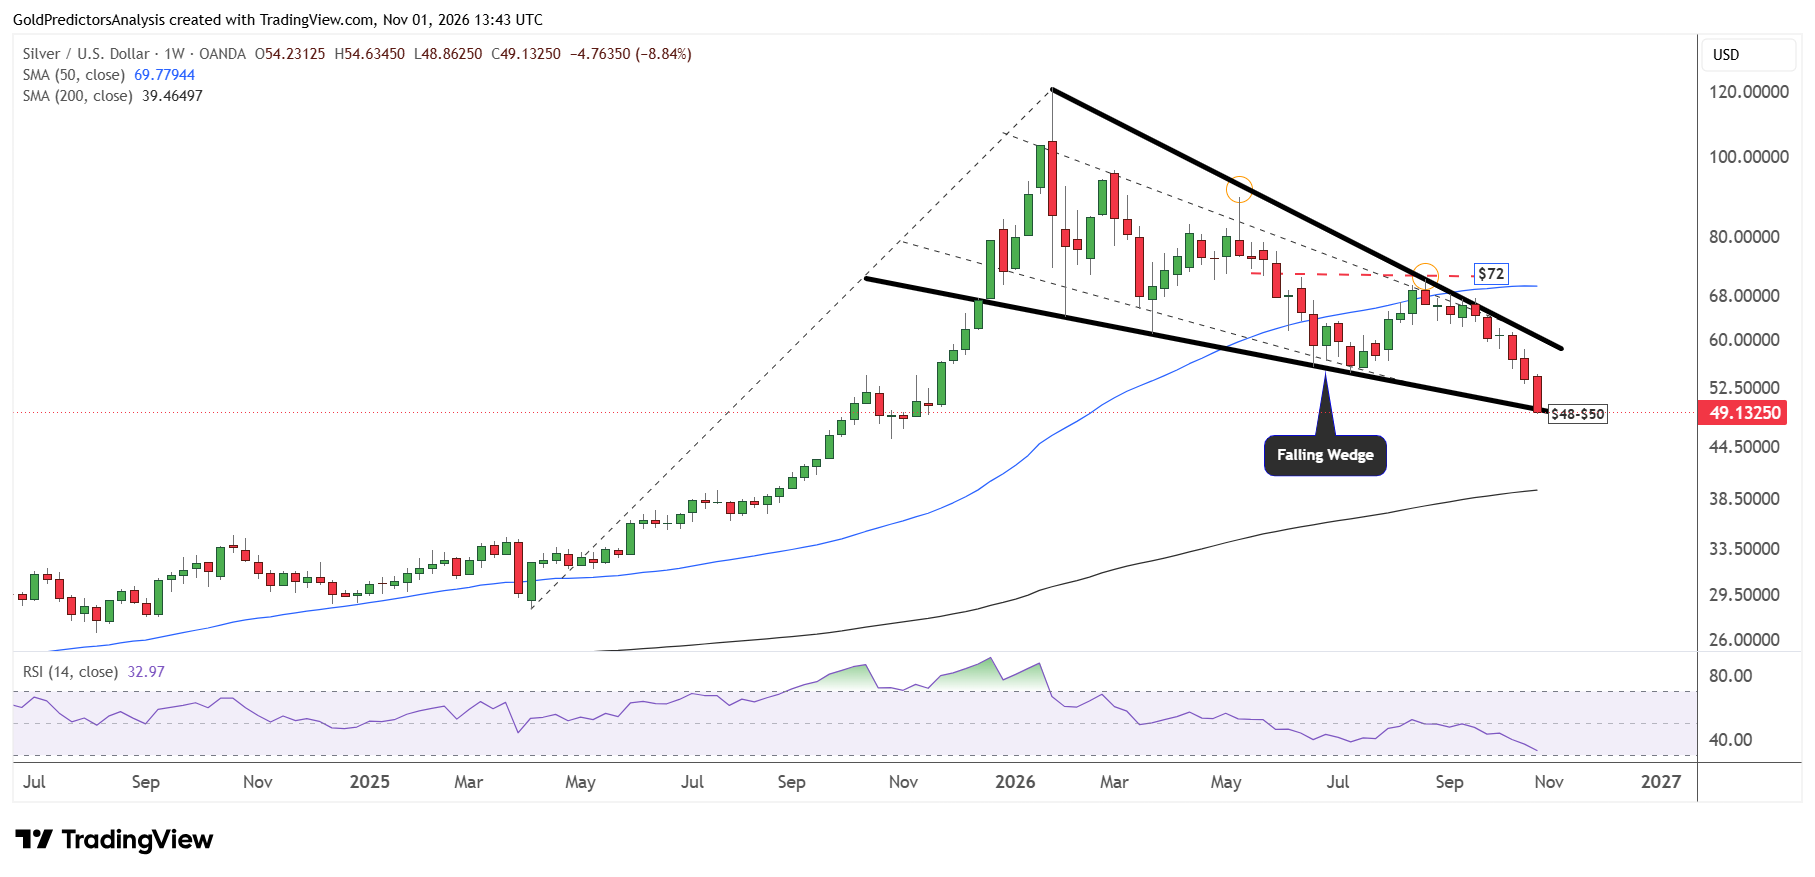
The RSI indicator is also approaching the 30 level, which suggests that silver prices may try to form bottom during the next few weeks. This kind of oversold condition in silver was previously seen in July 2022 and in March 2020. Both conditions produced strong long-term bottoms that triggered rally towards the $120 area.
A Break Below $48 Could Push Silver Towards $45 and $40
A break below the support line of the falling wedge pattern at $48 may likely push the price toward the long-term support area. This support can be seen in the other weekly chart below.
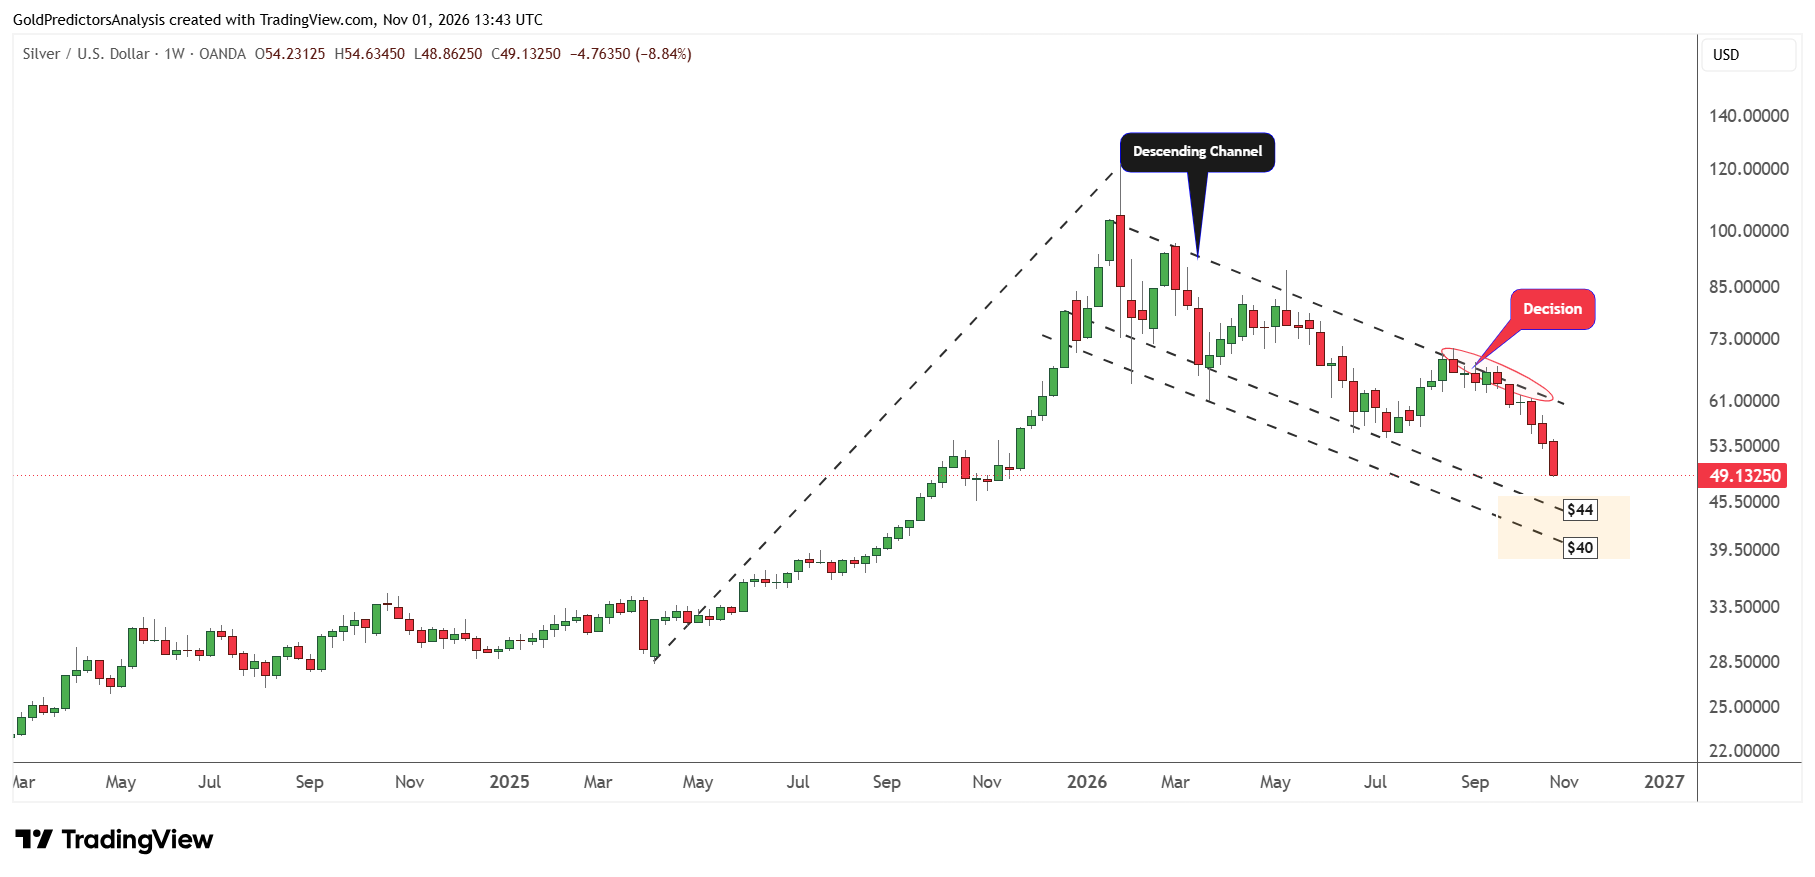
This chart shows the formation of a descending channel pattern from the highs of January 2026. The lower boundary of this channel lies at $44. If prices extend their decline during a deeper sell-off, they may reach the $40 region. Any drop to between $40 and $44, followed by a key reversal on the weekly chart, will likely offer the possibility of strong long-term bottom in the silver market.
What to Watch Next
Silver prices remain under pressure as technology sell-off continues. The high inflation environment is also putting pressure on silver prices due to expectations of high interest rates.
But the AI spending boom is expected to continue as hyperscalers are committing to massive capex spending in Q4. This will likely boost heavy industry and construction and lift the economy. The heavy boost in industry will likely support the demand for silver as silver is considered an industrial metal.
Therefore, the long-term outlook for silver remains strongly bullish and the current weakness may be considered a strong opportunity for long-term investors to accumulate at lower levels.
I think that the silver price is approaching a support area near the $48 to $50 region. But the strong selling pressure in the short and medium term suggests that prices may continue to drop further in the short term. A break below $48 in spot silver may open the way for further downside towards the $44 to $45 support area. The silver price needs to close above $60 to suggest a recovery.