



Gold (XAU) remains under pressure as U.S. Treasury yields rebound from key support at 5% and the risk of another rate hike by the Fed persists. The key support in gold is the $3,900 to $4,000 area. A break below this range will open the way for deeper correction in gold. Despite this correction, the structure for gold still remains bullish in the long term. The Dow to gold ratio and S&P 500 to gold ratio also suggest that gold prices may remain under bearish pressure in the short term. A reversal in these ratios may suggest a major bottom in the gold market.
High Treasury Yields Keep Gold Under Pressure
The gold price faces difficult mix of strong growth and high interest rates. The Federal Reserve maintained interest rates at the current range of 3.75%-4% in October. But two members voted for a rate hike. The Fed also said that the economy is growing well and inflation remains high.
This strong growth in economy can support the stock market. This gives the Fed less reason to lower interest rates which can limit any recovery in gold in the short term.
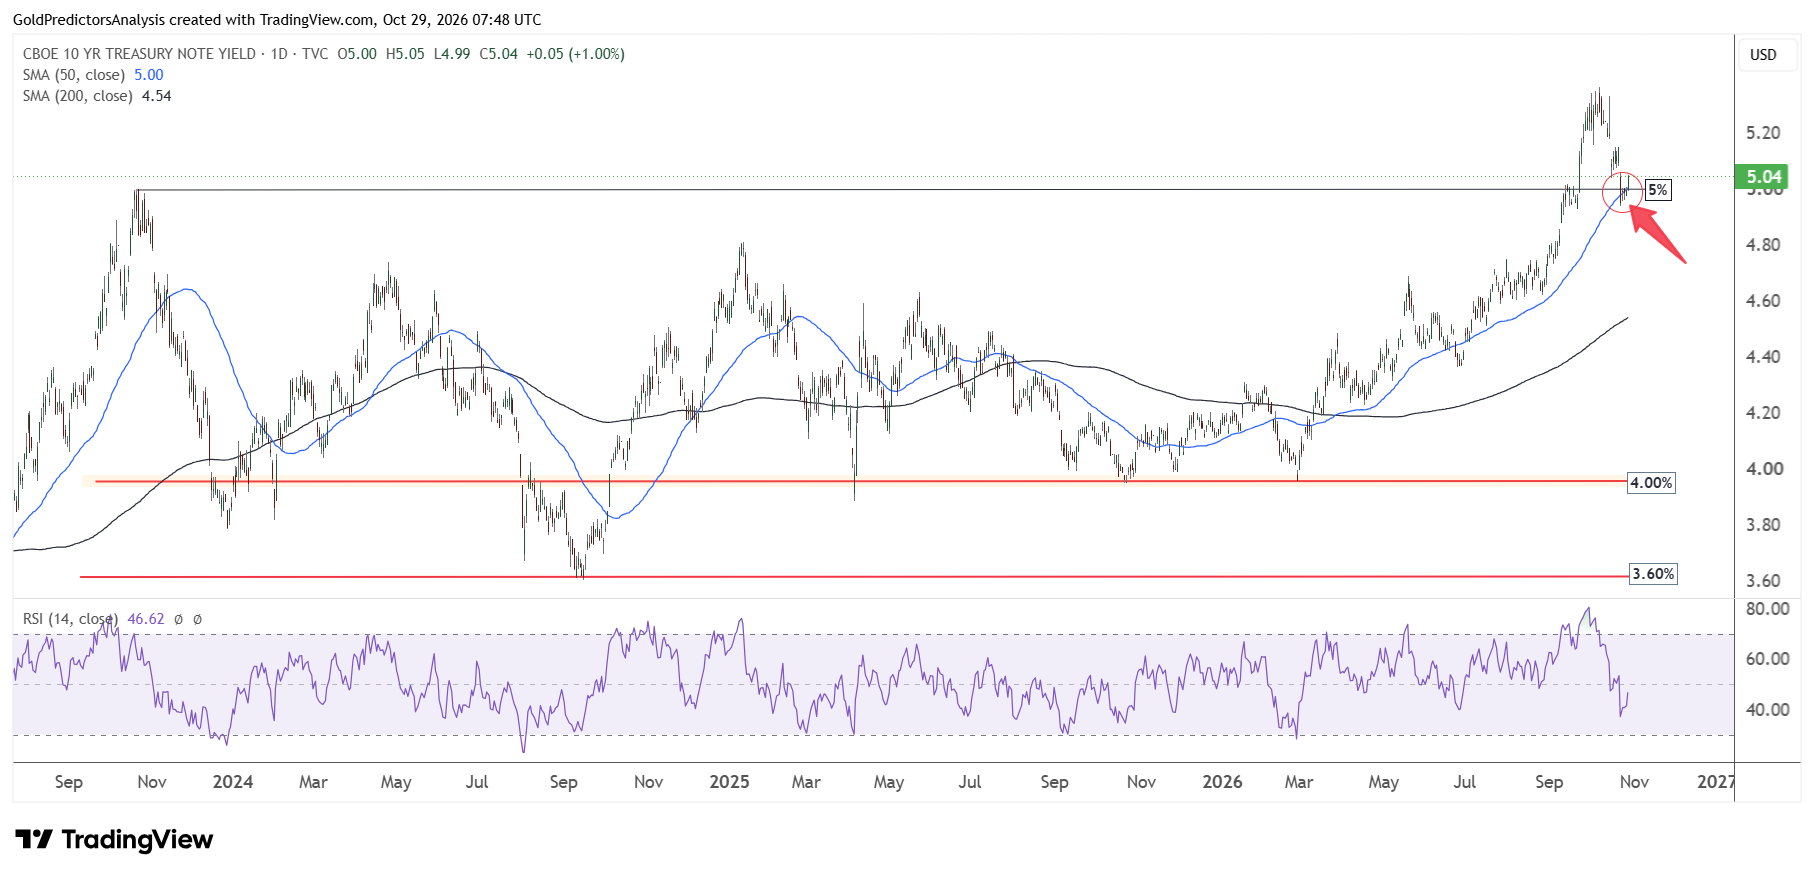
10-Year Treasury Yields Rebound From 5% Support
Treasury yields also show the same pressure. The chart below shows that the 10-year U.S. Treasury yield has produced a rebound from support in the 5% area after the Federal Reserve meeting. The strong structure and positive movements after the U.S.-Iran war suggest that Treasury yields may remain high in the short term.
Gold Price Forecast
Every new Gold analysis as it publishes, today's technical signal and key levels, live price — on one page.
See all Gold forecastsThe chart below shows that two-year Treasury yields remain well above the target range of Federal Reserve. It is observed that when U.S. Treasury yields started to increase in 2015 and continued to surge higher to mark a high around 2018, the Federal Reserve started to increase rates.
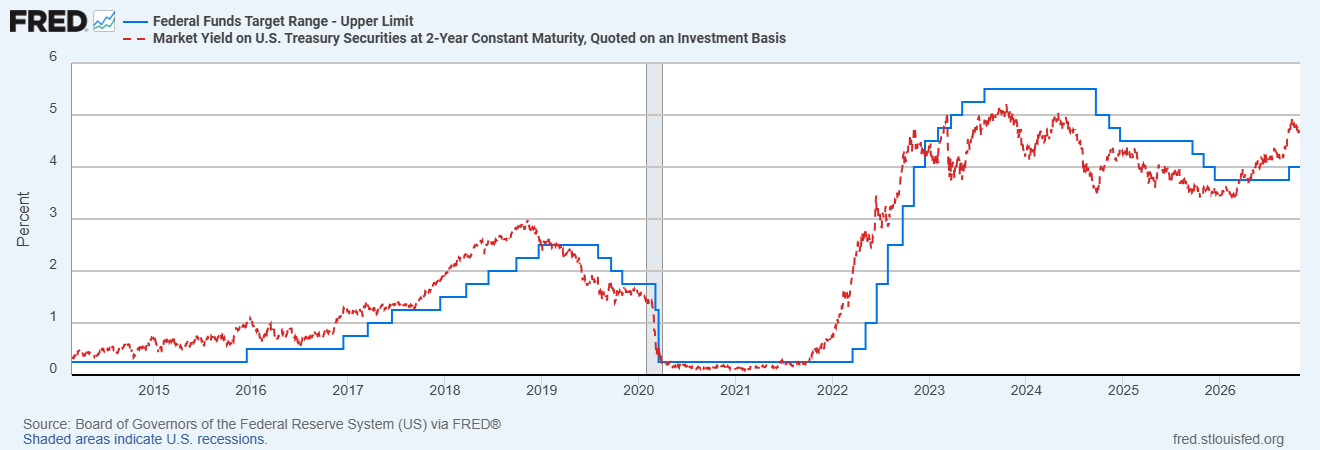
When U.S. Treasury yields dropped after 2018, the Federal Reserve reduced the target range to near 0.25% and maintained rates until 2022. Another increase in U.S. Treasury yields after the COVID-19 crisis resulted in the increase in interest rates towards 5.5%.
Now, the Treasury yields have again surged after the U.S.-Iran war and remain well above the target range. If U.S. Treasury yields remain elevated and continue to rally above 5%, it will likely increase expectations of another increase in interest rates in the near future. The increase in Treasury yields and interest rates may keep gold prices under pressure.
Market Stress and Inflation Data Shape Gold’s Outlook
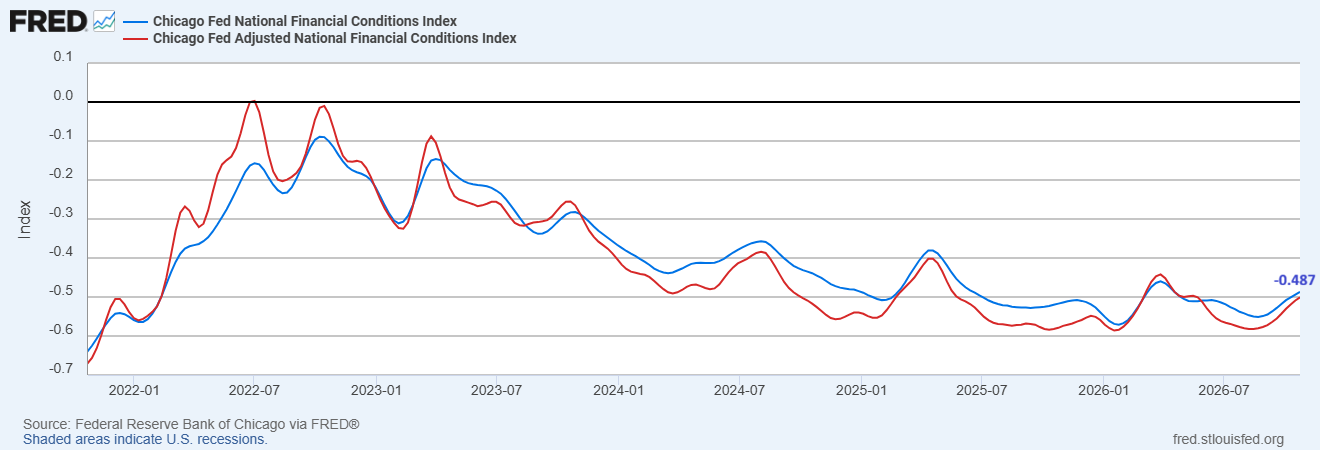
The latest financial conditions also show signs of stress in the market. The chart below shows that Chicago Fed National Financial Conditions Index has continued to drop since 2022 and remains negative. The index has created a rebound but still remains below average at −0.487.
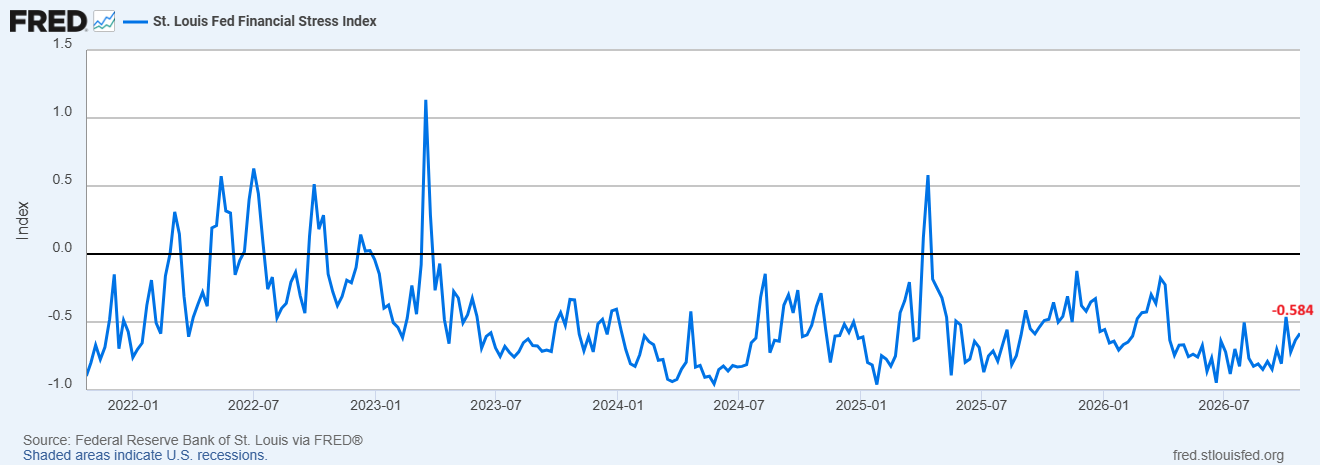
The St. Louis Fed Financial Stress Index also remains below zero in 2026. These readings suggest that financial conditions remain loose. This environment suggests that the demand for stocks remains high and reduces the demand for gold as a safe haven. A clear increase in the stress index will likely increase buying pressure on gold and create rebound against equities.
The market is now waiting for the Q3 GDP data and the PCE price index report which are due today. If growth remains strong and inflation remains high, it may keep the risk of another increase in rates by the Fed. But soft inflation may create rebound in gold prices.
I think that gold needs weak growth and the correction in real yields to form strong support in prices against stocks.
Dow to Gold Ratio Offers Clues to Gold’s Next Bottom
Past Ratio Peaks Marked Major Gold Bottoms
The correlation between the Dow Jones Industrial Average and gold prices has been used to pinpoint major bottoms and tops in the gold market. The relationship between these two assets can be understood by using the Dow Jones to gold ratio in the chart below. It is observed that gold prices have produced three major peaks during the past five decades.
Gold prices produced a major peak in 1980 at $873 when the Dow Jones to gold ratio hit a low near 0.99. Once the ratio started to accelerate higher after 1980, it produced a high at 44.84 in 1999. When the ratio produced a high, gold prices produced a major bottom and started to accelerate higher.
This initiated the gold bull market of the 21st century. During this gold bull market, the Dow to gold ratio started to drop towards the support area and produced low at the 6.39 level in 2011. Once the ratio produced a low, gold prices formed a major peak at $1,921 in 2011 and started to correct lower. The correction in gold after 2011 created a rebound in the Dow to gold ratio to form a high in 2018.
When the ratio produced a high, gold prices produced a major bottom again and started to surge higher. During this surge, gold produced another peak at $5,600 in 2026, when the ratio hit a low at 8.81.
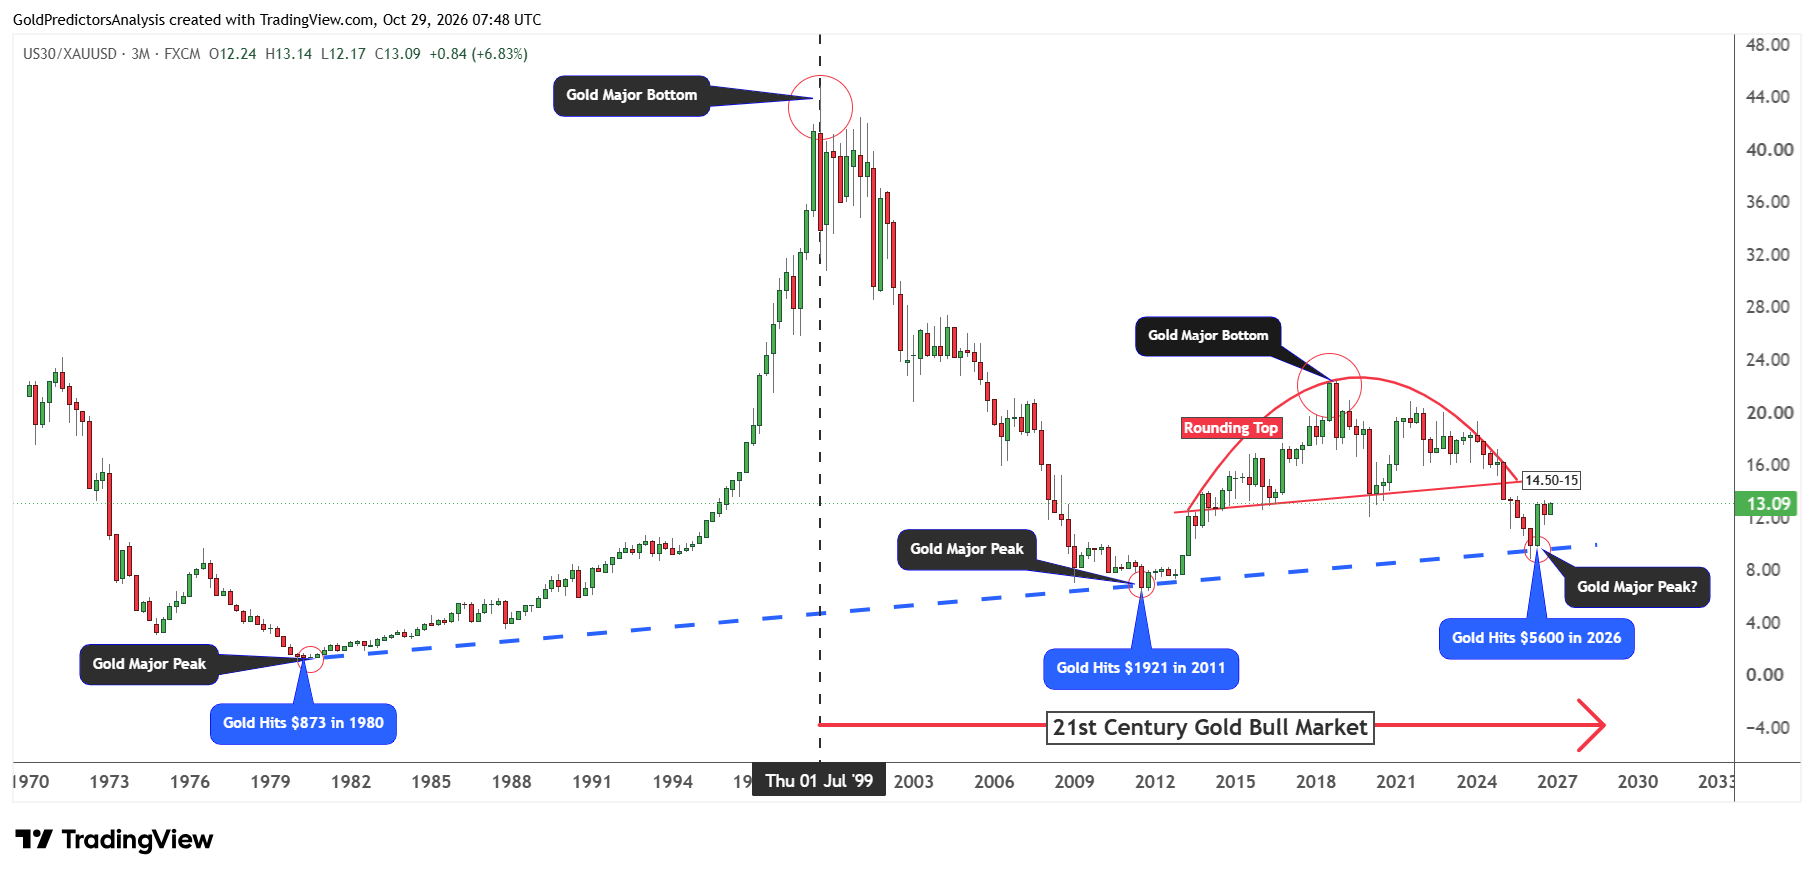
Dow to Gold Ratio Faces Resistance at 14.50–15
It is observed that the peak in 1999 and the rounding top formation from 2013 to 2024 in the ratio have produced strong bearish pattern. However, the ratio must break below the 8.81 level to initiate further downside. This analysis suggests that peaks in the ratio are correlated with major bottoms in the gold market.
Now, the ratio has already produced a low at the important support of the ascending trend line that stretches from the 1980 lows. This suggests that the ratio may accelerate higher towards the neckline of the rounding top pattern at the 14.50-15 level.
Once the ratio rebounds towards this resistance area, gold prices will likely remain under pressure before finding the next bottom. It is interesting to note that the market may be watching for a top formation in the ratio that may provide a case for the next major bottom in the gold market.
S&P 500 and Gold Ratios Point to Key Reversal Levels
S&P 500 to Gold Ratio Faces Resistance Near 2.0
The ratio of the S&P 500 to gold is also very useful to pinpoint major bottoms and tops in the gold market. It is observed that the S&P 500 to gold ratio marked a high during 2000-2001, when gold produced a major low of the 21st century.
The significant drop in the ratio from 5.47 in 2000 towards the low of 0.67 in 2011 suggests that the overall trend in the ratio remains bearish in the long term. This suggests that the long-term outlook for gold remains strongly bullish.
The ratio then produced a rounding top pattern, similar to the top pattern in the Dow to gold ratio. This rounding top pattern extends from 2014 to 2025. However, the ratio rebounded above the neckline of the rounding top pattern in 2026 during the major correction in the gold market.
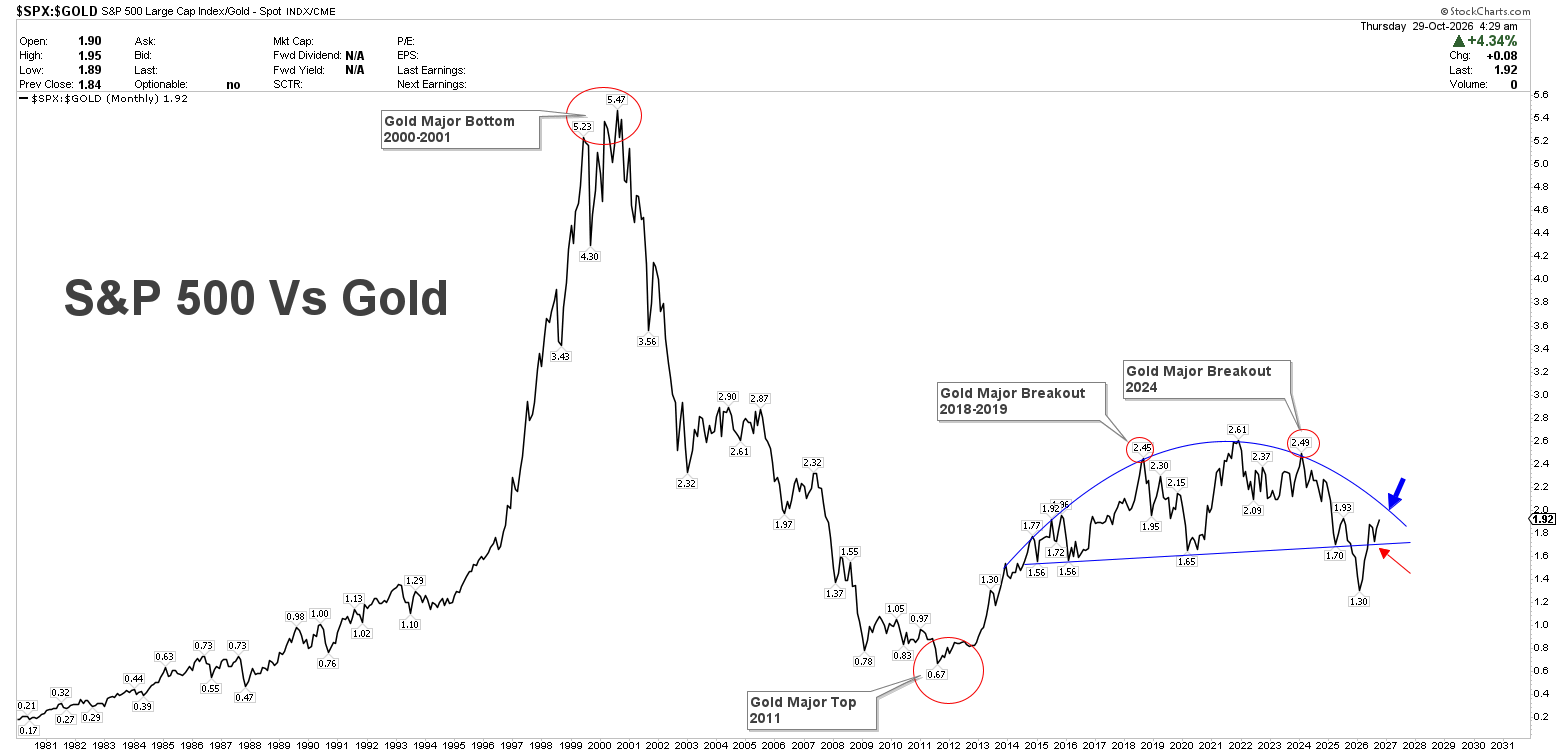
Now, the ratio is moving toward the resistance of the rounding top pattern near the 2.0 level. Once the ratio reaches this level, it may increase the possibility of major bottom in the gold market.
It is observed that when the ratio produced a peak at 2.45 in 2018, gold prices produced a major bottom and a major breakout. Similarly, when the ratio produced a peak at 2.49 in 2024, gold prices produced a major breakout and surged towards the record high of $5,600.
When the ratio produced a low at 1.30 in 2026, gold prices produced a high and started to correct lower. Now, the market is watching for the next peak in the ratio to look for the next bottom in gold.
Gold to S&P 500 Ratio Moves Towards 0.45 Support
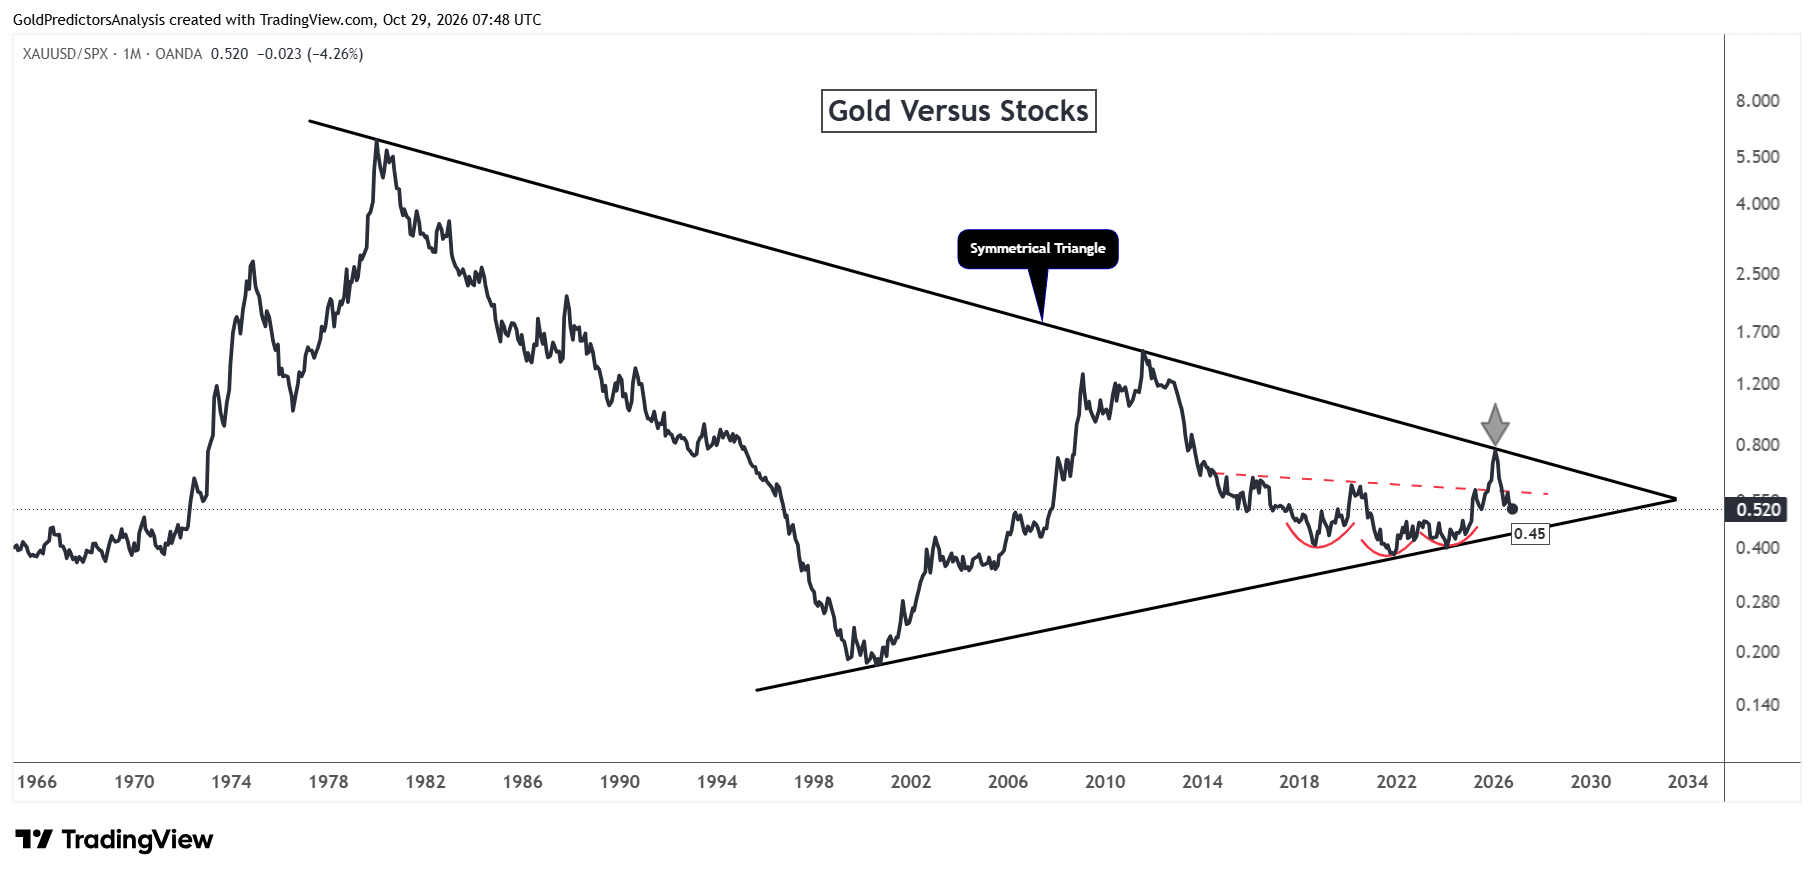
Similarly, the gold to SPX ratio also suggests that there may be more room for gold to drop toward the support area. This can be seen in the symmetrical triangle formation extending from the high in the 1980s.
The ratio produced a peak at the resistance of this triangle pattern at the 0.76 level in 2026, when gold prices produced a high at $5,600. Now, the ratio has broken below the red dotted trend line and is pushing towards support at the 0.45 level of the symmetrical triangle. Once the ratio hits the 0.45 area, it will increase the possibility of a bottom in gold and may create a strong rebound.
Gold Price Forecast: Key Support at $3,900–$4,000
From a technical perspective, the gold price is currently consolidating around the key level and looking for the next move. If the price can successfully break this key level, it may initiate deeper correction toward the key support areas.
This key level is defined by the support of the ascending channel pattern that was previously broken in 2025. This ascending channel pattern stretches from the 1976 lows. If the gold price maintains support in the $3,900-$4,000 range and triggers a rally toward the $5,600 level, it will likely confirm major bottom in the long term.
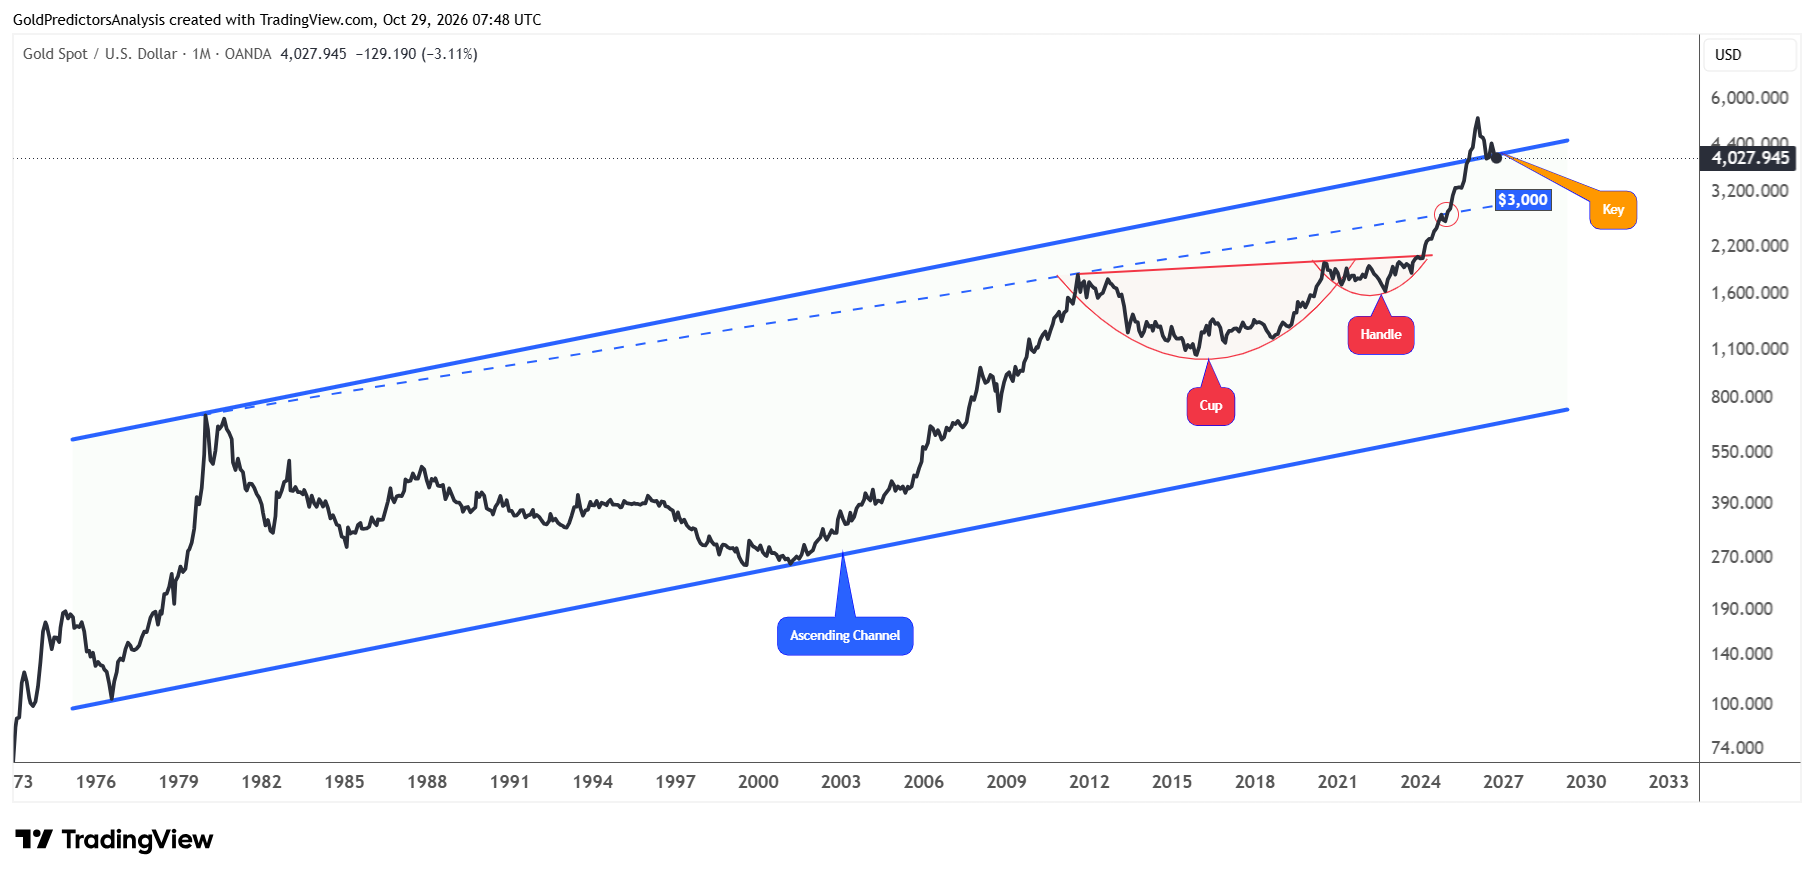
However, if the price breaks below the $3,900-$4,000 range, it will likely open the way for a further drop towards the $3,000-$3,500 range. The $3,000 level remains the long-term support of this bull market. This support is defined by the ascending trend line that stretches from the high in the 1980s and runs through the 2011 highs.
As long as the gold price remains above the $3,000 level, it will likely form bottom and rally higher again towards new record highs. The formation of cup and handle patterns within this ascending channel pattern from August 2011 to February 2024 suggests that the overall price structure for gold remains strongly bullish.
What to Watch Next for Gold Prices
The strong growth in economy and persistent inflation may keep U.S. Treasury yields in positive territory. This may limit the recovery in gold. But weak growth and increase in market stress may provide support to gold prices.
The key level to watch in gold is the range of $3,900 to $4,000. A break below this range may extend correction in gold towards the $3,000 to $3,500 area. This is considered support in the gold market in the long term. But if the price holds the current range, it may initiate a rebound higher.
The Dow to gold ratio near 14.5 to 15 and the S&P 500 to gold ratio near 2.0 also remain important to watch for the next move in gold. I think that if these ratios form a top and start to drop, it will increase the possibility of major bottom in the gold market in the long term.
Read more: Rebound at Risk as Treasury Yields Remain Near 5%