Grain prices consolidated in early trade on Tuesday. The lower-than-expected corn and soybean acreage reported last week reported by the USDA was partially offset by gains in other crops with all wheat acreage up more than one million acres from market expectations and total planting intentions down 1.1 million acres from last year. In general, expectations for oilseed acreage planting were down. USDA noted that soybean planting intentions were down from last year in 20 of the 31 states that were estimated. The surprising lack of enthusiasm for soybeans specifically and oilseeds more generally is likely due to the relatively large ending stocks projections for 2017/18 and 2018/19. In addition, concerns that China may impose trade barriers on soybean imports from the US may have also weighed on farmers minds when filling out the USDA survey.
Corn Prices
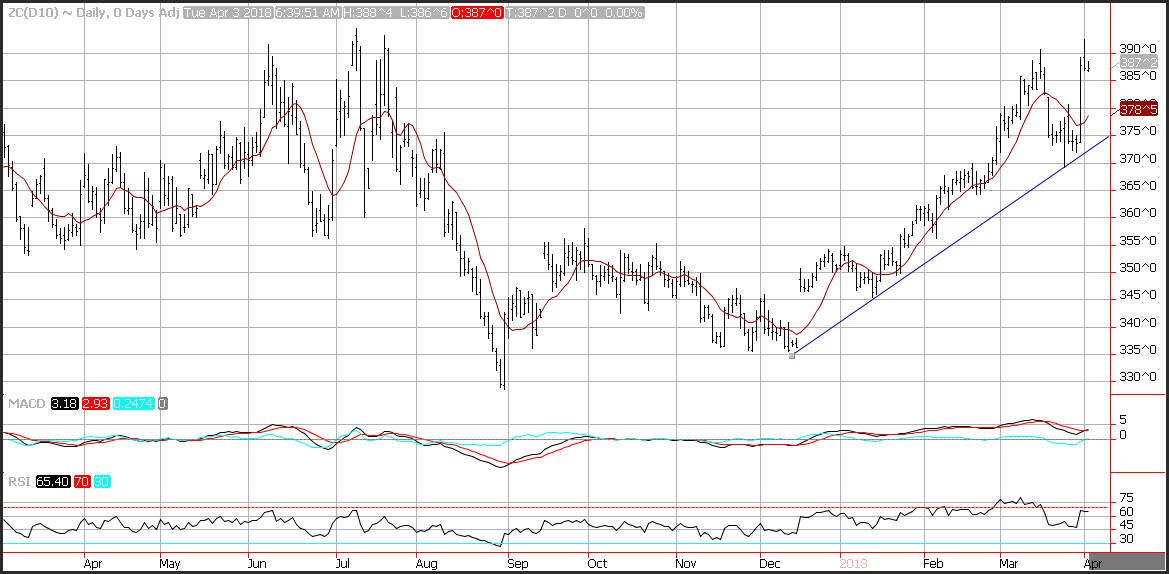
Corn prices consolidated early on Tuesday after moving sideways on Monday. Prices are poised to test the July 2017 high at 393 per bushel. Support is seen near the 10-day moving average at 3837. Momentum has turned positive the MACD (moving average convergence divergence) index recently generated a crossover buy signal. This occurs as the MACD line (the 12-day moving average minus the 26-day moving average) crosses above the MACD signal line (the 9-day moving average of the MACD line). The MACD histogram is printing in the black with a down sloping trajectory which points to higher prices.
Soybean Prices
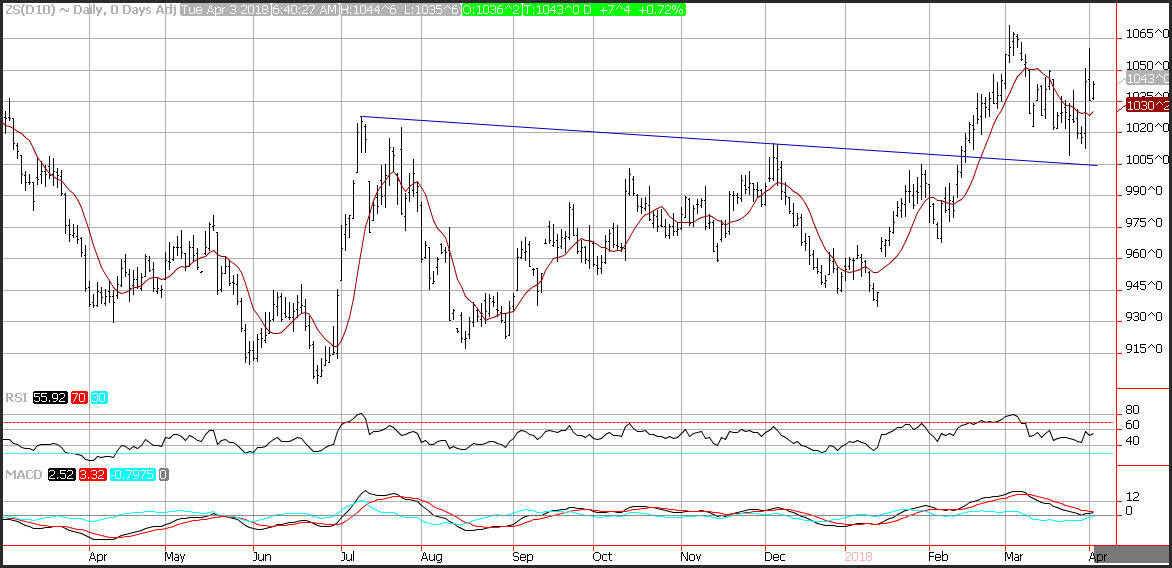
Soybean prices are consolidating after breaking out Thursday following a smaller than expected planting intentions number. Prices sliced through trend line resistance which is a downward sloping trend line that comes in near 1031. Prices are poised to test resistance near the March highs at 1071. Support is seen near the 10-day moving average at 1030. Momentum has turned positive the MACD (moving average convergence divergence) index recently generated a crossover buy signal. This occurs as the MACD line (the 12-day moving average minus the 26-day moving average) crosses above the MACD signal line (the 9-day moving average of the MACD line). The MACD histogram is printing in the black with a down sloping trajectory which points to higher prices.
Wheat Prices
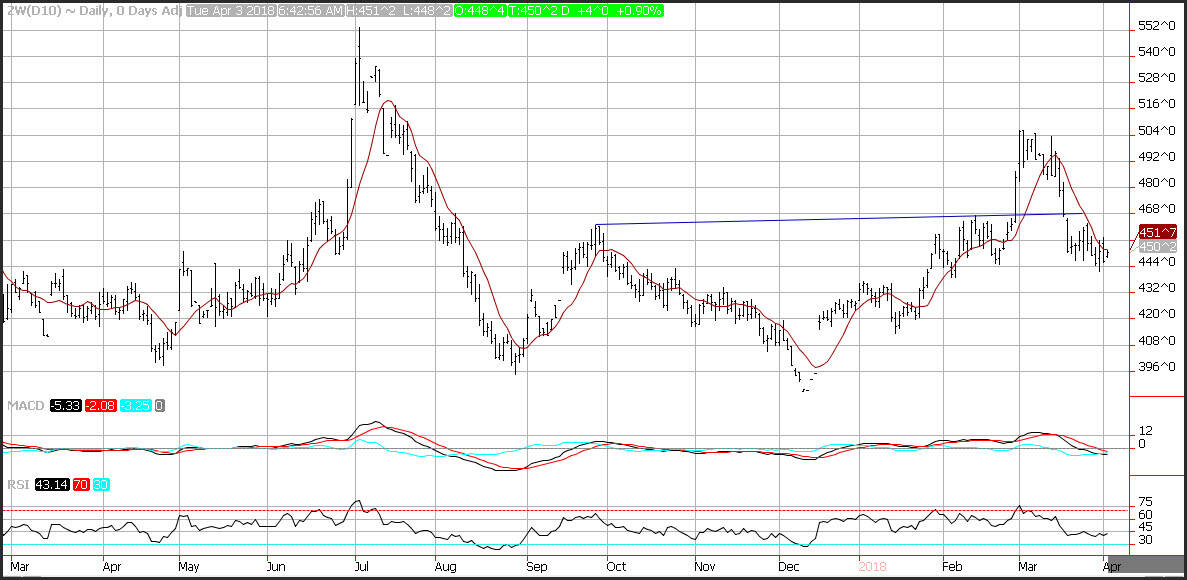
Wheat prices are generating a bear flat pattern which is a pause that refreshes lower following a bearish planning report for Wheat. Support is seen near the March lows at 441. Resistance is seen near the 10-day moving average at 452 and then the March highs at 506. Momentum has turned negative as the MACD (moving average convergence divergence) index recently generated a crossover sell signal. The MACD histogram is printing in the red with a down sloping trajectory which points to lower prices.