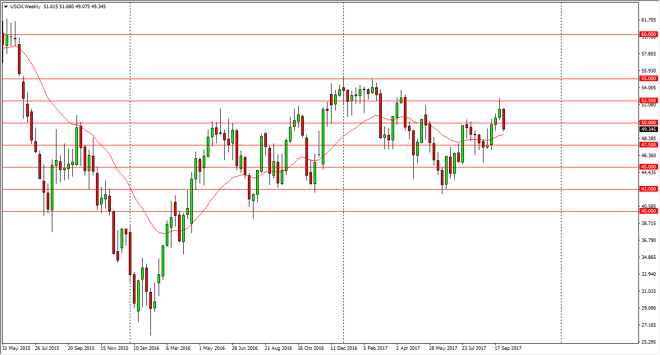
WTI Crude Oil The WTI Crude Oil market broke down during the week, slicing through the $50 level. I think that the $49 level is massively supportive, so
The WTI Crude Oil market broke down during the week, slicing through the $50 level. I think that the $49 level is massively supportive, so if we can break down below there I think that the market continues to go lower, perhaps reaching towards the $47.50 level underneath. Alternately, if we can break above the $50 level, the market should then go towards the $52.50 level. The markets continue to look volatile, and this pullback is probably to be expected. We have a significant amount of oversupply in the market occasionally coming in and affecting the pricing. However, there are a lot of concerns about OPEC, but quite frankly I think it is starting to become very obvious that OPEC has lost its ability to control pricing, and perhaps some of its members.
The bread market broke down below the bottom of the shooting star from the previous week, so that was a technical cell signal. We tested the $55 level, and I think that if we can break down below that level, the market probably goes down to the $52.50 level underneath, which has been important in the past. Alternately, if we break above the top of the weekly candle for the past week, we could go back towards the $60 handle. A break above there census market much higher. I think we continue to see a lot of volatility, as there is a significant amount of oversupply in the marketplace. Ultimately, I think that we have gotten a bit overextended, so I think it’s only a matter of time before we drop, which at the very least would be an opportunity to pick up value, if not start shorting this market if the support comes back into play.
Chris is a proprietary trader with more than 20 years of experience across various markets, including currencies, indices and commodities. As a senior analyst at FXEmpire since the website’s early days, he offers readers advanced market perspectives to navigate today’s financial landscape with confidence.