


WTI Crude Oil
WTI entered Friday with the latest U.S. inventory figures pointing to a tighter petroleum balance, particularly in distillates. The EIA’s November 4 report, covering October 30, put commercial crude stocks at 409.8 million barrels and distillate inventories at 99.3 million barrels. The agency also reported weekly declines of 900,000 and 3.6 million barrels, respectively, using unrounded underlying data. Distillates were 11% below their year-earlier level.
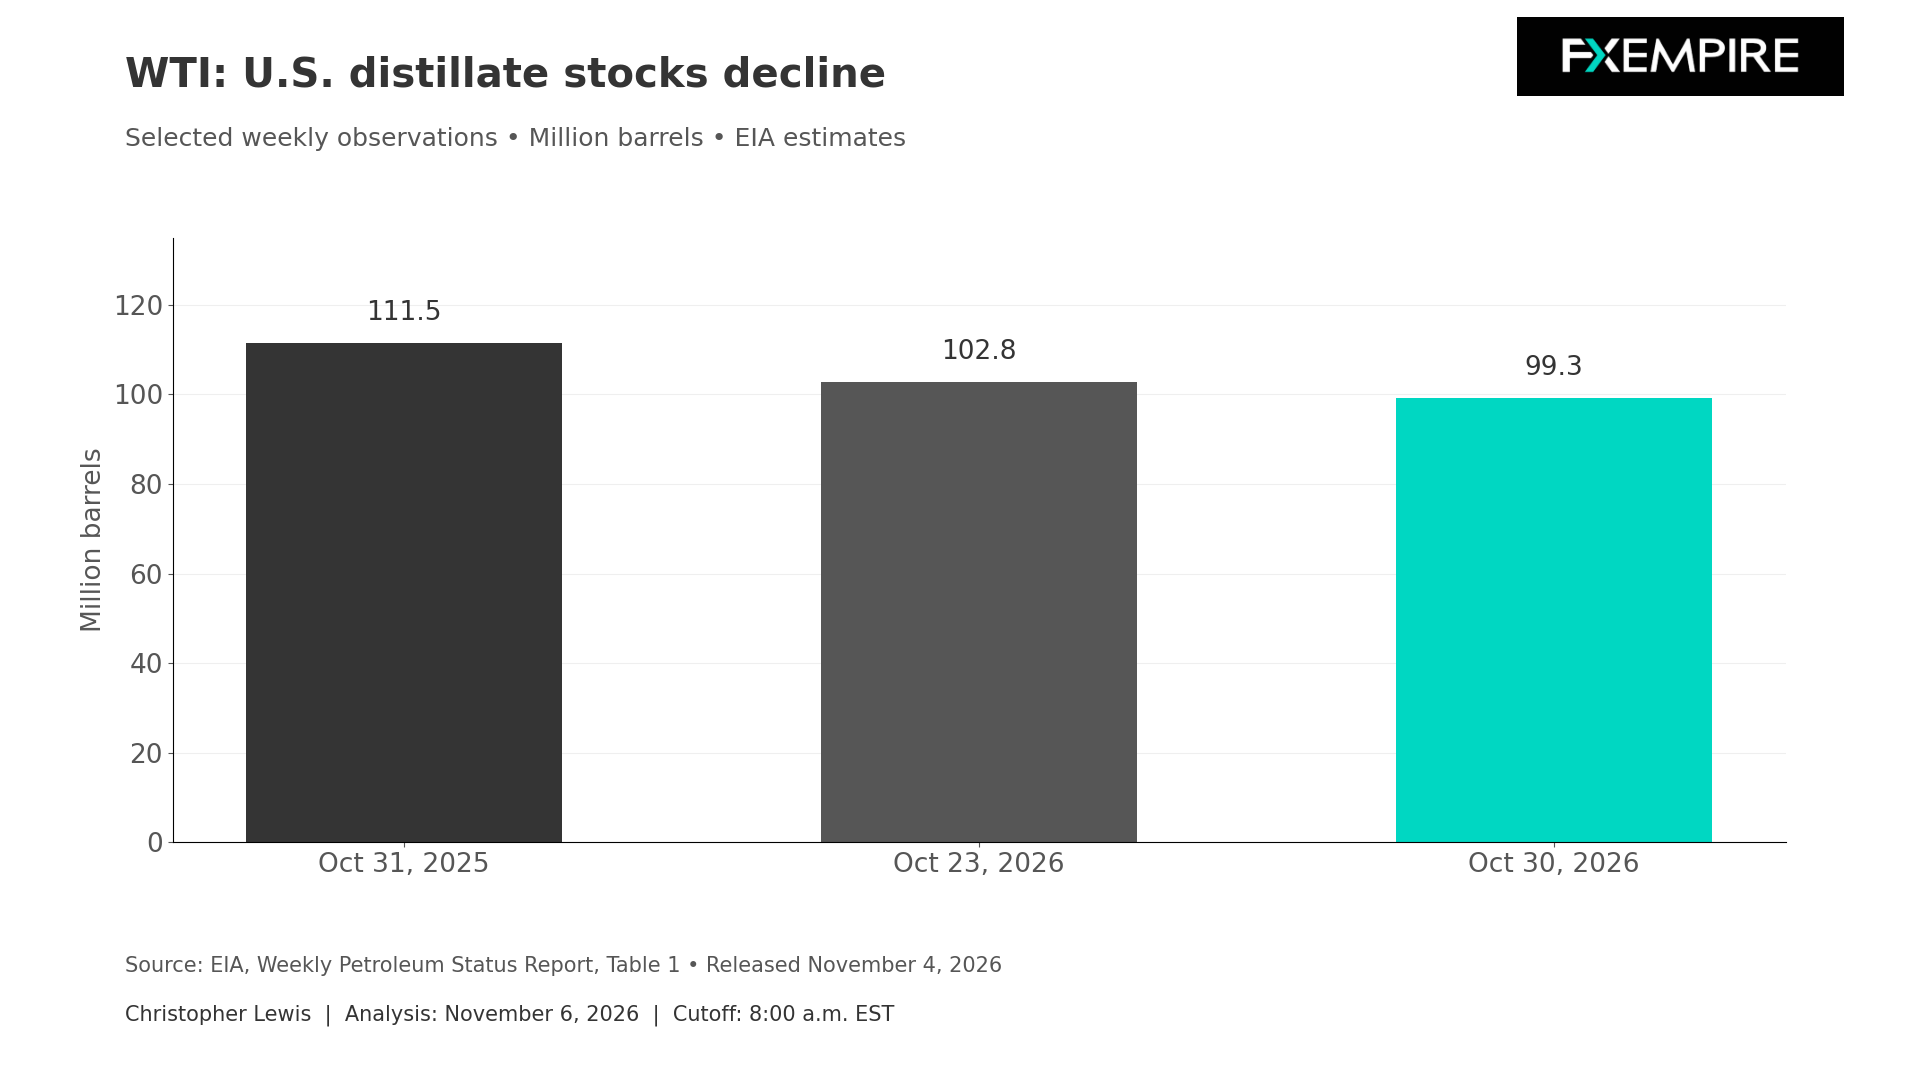
Using a bit of distinction will matter, as a relatively small crude draw can conceal a more meaningful shortage of finished fuels. Refiners buying crude oil to produce products that consumers need sustain depletion of diesel and heating oil inventories and can support processing demand even when the headline crude figure looks unremarkable.
Refinery Inputs Over 16 Million Barrels a Day
Refinery crude inputs reached 16.725 million barrels per day, while estimated domestic production was 14.003 million barrels per day. Four-week distillate product supplied averaged 4.175 million barrels per day, up 8.7% from a year earlier. Gasoline’s corresponding measure was down 0.4%. This suggests that demand conditions differ substantially across fuels, according to the EIA.
For WTI, the practical question will be whether product demand keeps refineries drawing on crude inventories. Strong diesel requirements would support this idea. Conversely, weaker transport activity, greater product imports, or replenished inventories could ease some of this pressure. The year-earlier comparison also helps separate seasonal inventory movements from a broader tightening. The draw is more consequential when starting with a cushion that is already somewhat limited.
Nevertheless, low product stocks should not be translated mechanically into a crude price target. The next U.S. petroleum report is scheduled for Thursday, November 12, at noon Eastern, reflecting the Veterans Day holiday during the previous session. Until then, the most useful confirmation would be continued product stock depletion alongside sustained refinery demand.
Jobs Soaring in the USA

At 8:30 a.m., the United States announced that 165,000 jobs were added last month, so this does at least help with the idea of more demand. From a technical analysis standpoint, it looks like the oil market is simply hanging around the $90 level, waiting for its next catalyst. I remain fairly neutral at the moment, but I do recognize that short-term dips, in general, are typically bought into by bullish traders.
Brent Oil Price Forecast
Every new Brent Oil analysis as it publishes, today's technical signal and key levels, live price — on one page.
See all Brent Oil forecastsBrent Crude Oil
The Brent international backdrop remains dominated by the availability and movement of physical barrels.
The latest available EIA Short-Term Energy Outlook was released October 6, using a model cutoff on October 1. The next update for this information is scheduled for November 10. In the October outlook, the EIA estimated global inventory withdrawals of 1.9 million barrels per day during the third quarter and forecast a further 700,000-barrel-per-day draw in the fourth quarter. It also projected fourth-quarter Middle East production shut-ins averaging 4.5 million barrels per day.
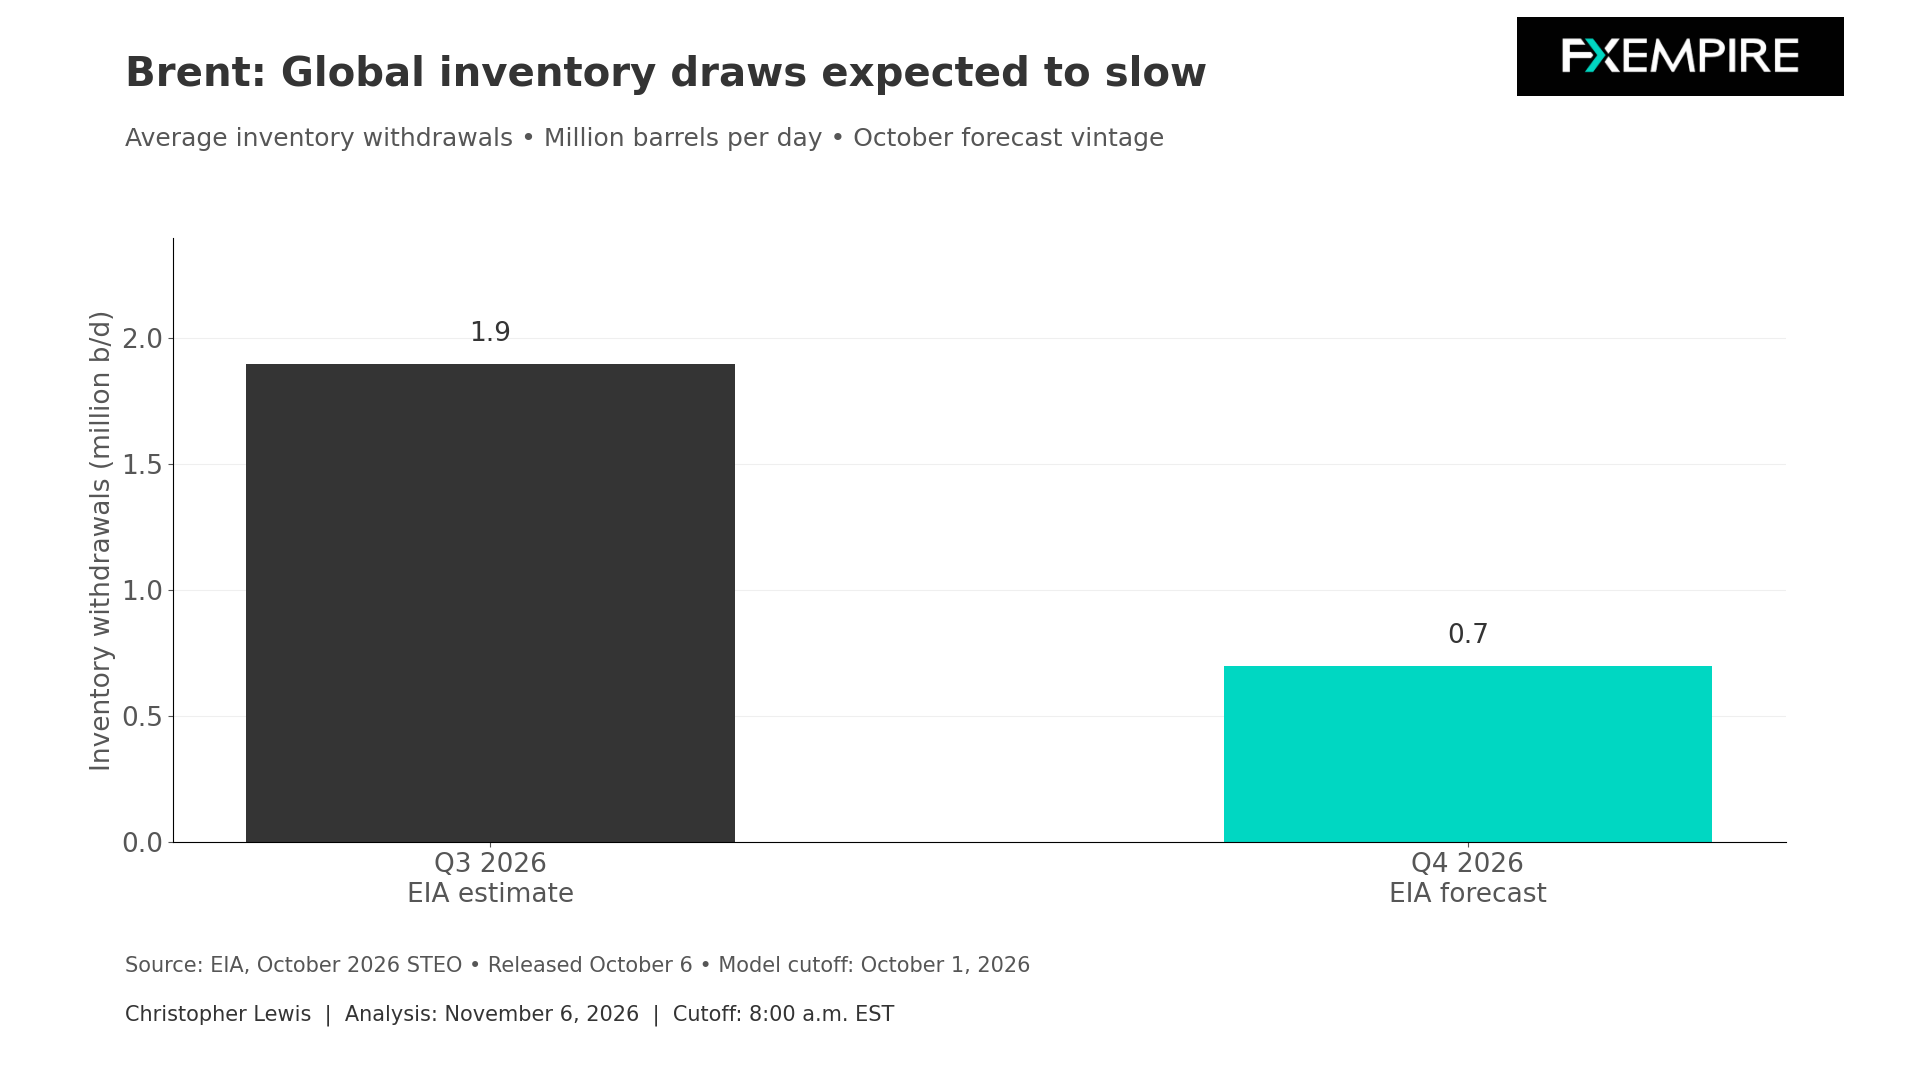
These are estimates and forecasts, not measurements. The chart just below shows a slower expected draw, but a slower withdrawal still means inventories are being depleted. This is important when assessing apparently reassuring supply headlines, which undoubtedly will occur.
For Brent, export access is as important as production capacity. Oil that cannot reach an importing refinery does not resolve the immediate problem. Alternative routes can help, but the value depends on operating capacity, transit time, and reliable delivery, something that has been stymied by the conflict in the Middle East for months.
The opposing risk is demand, though. Expensive energy can encourage conservation, reduce discretionary travel, and squeeze industrial margins. If consumption weakens faster than supply recovers, inventories could stabilize sooner than expected. Conversely, resilient demand combined with renewed transport constraints would leave buyers competing for a limited pool of deliverable crude.
Tuesday’s EIA update will test whether October’s assumed inventory draw and production disruption still support an outlook for this market. Changes in the underlying supply-and-demand balances deserve more attention than an isolated revision.
Technical Outlook
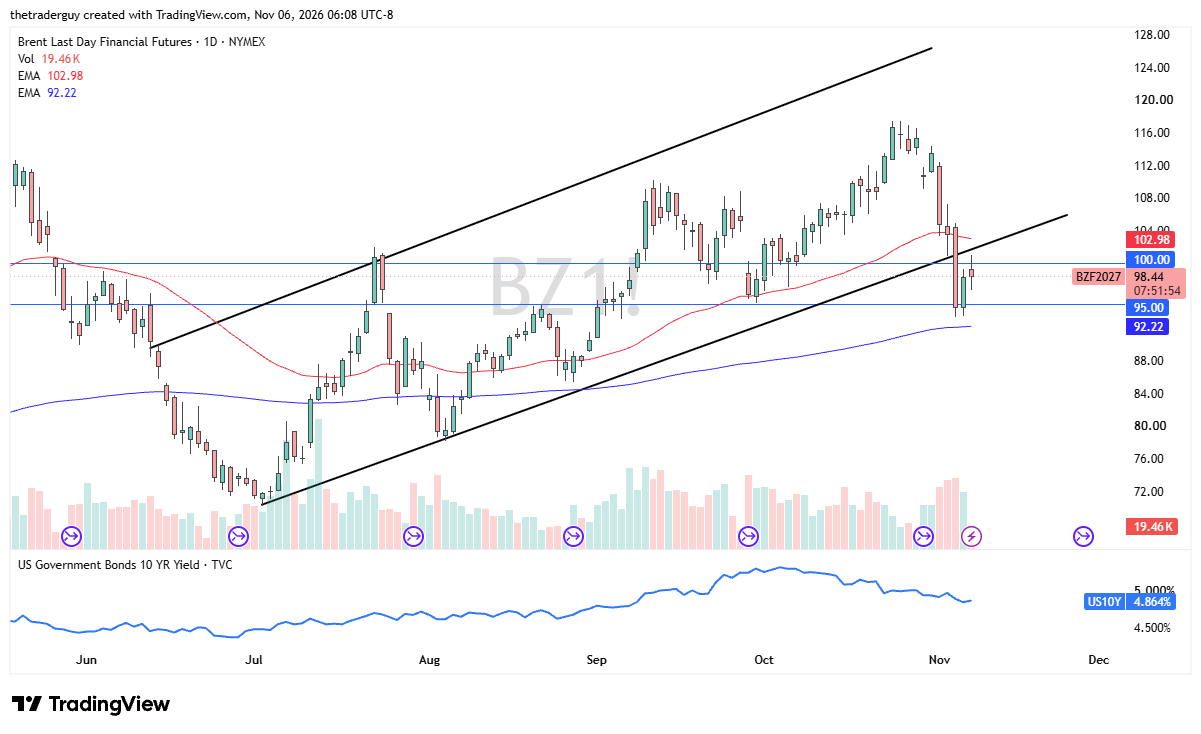
On Friday, with that jobs report showing signs of strength, the technical analysis looks very much like the WTI market, in the sense that we have gone back and forth, simply chopping around. It does look like a market that is trying to find its floor. It also sees the $100 level as a bit of a barrier, right along with a $95 floor in the short term. I still favor the upside over the longer term, but I recognize that right now we seem to be in a wait-and-see mood.