


Oil prices edged higher on Monday after breaking out on Friday as traders eye OPEC and attempt to determine if the cartel will extend its production cuts further into 2018. On Friday’s Baker Hughes reported that active oil rigs increased by 1, which turned into a non-event.
Technicals
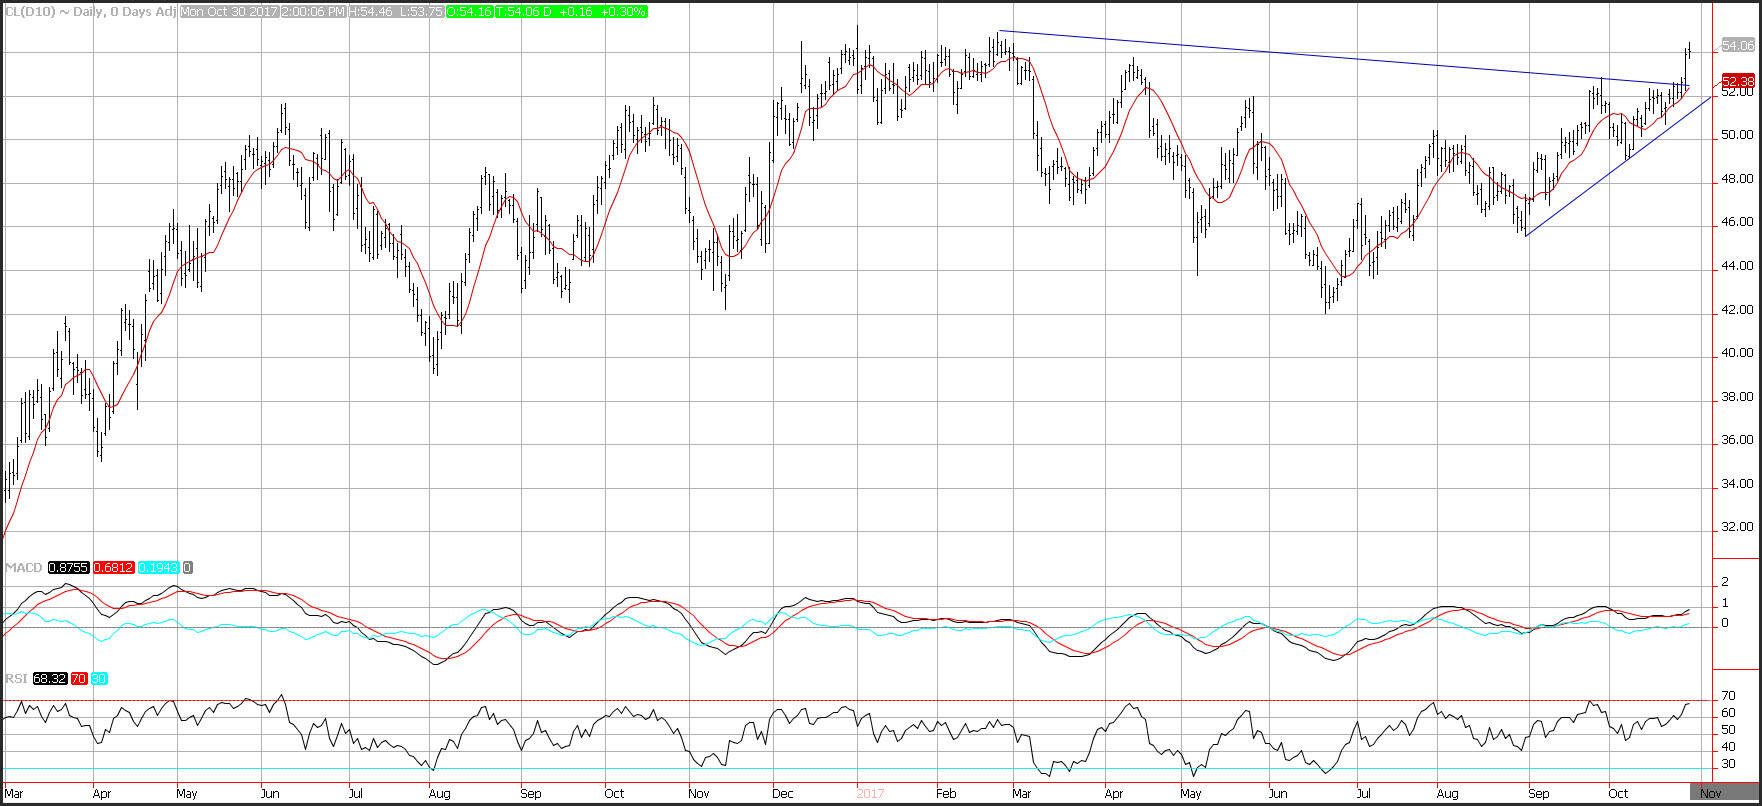
Crude oil prices consolidated on Monday, after breaking out to fresh 6-month highs, and poised to test target resistance which is seen near the February highs near 54.94. Support on crude oil is seen near the 10-day moving average at 52.38. Momentum has turned positive as the MACD (moving average convergence divergence) index generated a crossover buy signal. This occurs as the MACD line (the 12-day moving average minus the 26-day moving average) crosses above the MACD signal line (the 9-day moving average of the MACD line). The index moved from negative to positive territory confirming the MACD crossover. The MACD histogram is printing in the black with an upward sloping trajectory which points to higher prices for crude oil.
Forecasts on Crude Oil are Climbing
It appears that analysts and investment banks last quarter reduced their oil price forecasts as OPEC’s production cuts drew down the global oil oversupply slower than initially expected, and rising U.S. shale production capped any short-lived oil price gains.
At the end of the Q3 OPEC and the International Energy Agency (IEA) started reporting stronger-than expected global oil demand growth and an accelerated pace of inventory declines, the market sentiment began to change. As 2018 and the November 30 OPEC meeting draw nigh, the cartel is said to be favoring a 9-month extension of the deal through the end of next year.
The possibility of such supply restriction throughout the whole of 2018, combined with expectations of strong oil demand growth and concerns over few new sources of supply due to years of underinvestment after the 2014 oil price crash, has prompted some analysts to warn that fear of the glut will turn into fear of a supply crunch next year. In addition, some investment banks expect the U.S. crude oil production in 2018 to underperform forecasts, which could remove some part of the cap on oil prices that American shale has kept since the start of this year.
Now analysts are changing their tunes. Bank of America Merrill Lynch also expects a supply shortage of 230,000 barrels a day this year. The bank also raised its WTI and Brent projections for the short term, seeing Brent prices averaging $54 in Q4 2017 and $52.50 in the first half of 2018, up from the previous estimates of $50 and $49.50, respectively. BofA Merrill Lynch also revised up its WTI price forecast to $49 this quarter, compared to the previous $47 estimate.
RBC Capital Markets also raised its oil prices forecasts for next year, albeit by just a dollar or two. WTI is now seen averaging $51 next year, up from the previous $50 a barrel forecast, while the Brent price view was raised to $55 from $53.19.
In its latest Short-Term Energy Outlook, EIA expects total U.S. crude oil production to average 9.2 million bpd this year and 9.9 million bpd next year, which would mark the highest annual average production in U.S. history, beating the previous record of 9.6 million barrels per day set in 1970.
Rising U.S. crude production and gains from other non-OPEC countries will likely act as “the ceiling for aspirations of higher oil prices” next year, the IEA said earlier this month.
According to Standard Chartered, shale activity has been declining as a reflection of rising costs, a drop in initial well productivity, increased breakeven outside the sweetest geological spots, and “cash-flow constraints at unsustainably low prices.”
While banks and analysts were quick to slash their oil price projections earlier this year, some of them are now very cautiously lifting their forecasts by slim margins. Still, voices are growing that a supply crunch may come sooner rather than later, and that U.S. shale resilience may have been overestimated. U.S. Personal Income Rises
U.S. personal income rose 0.4% in September and spending climbed 1.0%. August’s 0.2% increase in income was not revised, nor was the 0.1% spending gain. Compensation improved 0.4% after the prior 0.1% gain. Wage and salary income rose 0.4% following the prior 0.1% (revised from unchanged). Disposable income was up 0.4% too, from 0.1%. The savings rate slowed to 3.1% from 3.6%. The PCE chain price index climbed 0.4%, double the prior 0.2% gain. It’s up 1.6% year over year compared to the prior 1.4% year over year. The core rate was inched up 0.1%, the same as in August, and was steady at the 1.3% year over year rate from August, and is slower than the 1.4% year over year in July and 1.5% year over year in June.