


Crude oil prices attempted to move higher in U.S. AM trading but were unable to hold on to gains despite a larger than expected draw in crude oil inventories reported by both the EIA and the API. Imports were lower which led to the decline in stocks, and demand remains robust as exports of distillates continue to rise on a year over year basis.
Technicals
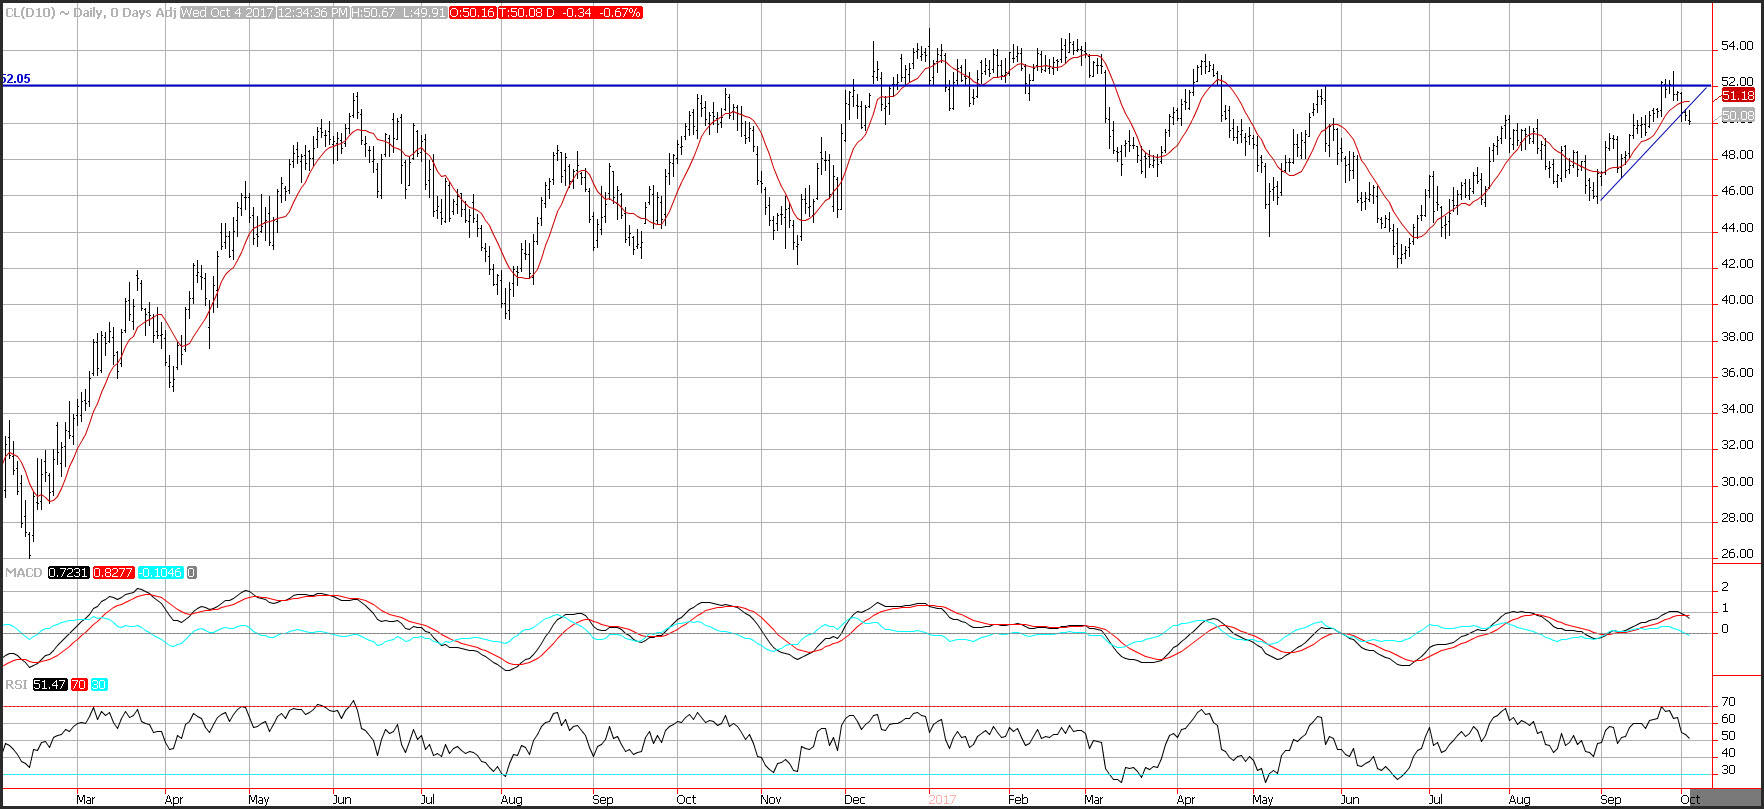
Crude oil prices are lower on Wednesday, as a large inventory draw in crude oil was largely ignored by the markets. Prices closed below trend line support which is now resistance seen near an upward sloping trend line near 51. Support is seen near the August lows at 47. Momentum has turned negative as the MACD (moving average convergence divergence) index recently generated a crossover sell signal. This occurs as the spread (the 12-day exponential moving average minus the 26-day exponential moving average) crosses below the 9-day exponential moving average of the spread. The signal line moved from positive to negative territory confirming the crossover sell signal. The MACD histogram is printing in the red with a downward sloping trajectory which points to lower prices for crude oil.
Imports Continue to Decline
On Wednesday the Department of Energy revealed that U.S. crude oil imports averaged over 7.2 million barrels per day last week, down by 213,000 barrels per day from the previous week. Over the last month, crude oil imports averaged over 7.1 million barrels per day, 10.7% below the same four-week period last year.
Inventories Dropped
The decline in imports led to a drop-in inventories. The EIA reported on Wednesday that U.S. commercial crude oil inventories decreased by 6.0 million barrels from the previous week, compared to expectations that crude would draw by 1-million barrels. Gasoline inventories increased 1.6 million barrels last week, while distillate fuel inventories decreased by 2.6 million barrels last week and are in the lower half of the average range for this time of year. Propane inventories decreased by 0.4 million barrels last week and total commercial petroleum inventories decreased by 6.1 million barrels last week.
Demand Remains Strong
Total product demand over the last month period averaged over 20.2 million barrels per day, up by 1.9% from the same period last year. Over the last month, gasoline demand averaged about 9.5 million barrels per day, up by 1.3% from the same period last year. Distillate fuel demand remains strong and averaged over 4.0 million barrels per day over the last month, up by 12.0% from the same period last year.
Refinery Inputs Declined
U.S. crude oil refinery inputs averaged over 16.0 million barrels per day during the week ending September 29, 2017, 145,000 barrels per day less than the previous week’s average. Refineries operated at 88.1% of their operable capacity last week. Gasoline production remained virtually unchanged last week, averaging about 9.9 million barrels per day. Distillate fuel production increased last week, averaging over 4.9 million barrels per day
The American Petroleum Institute (API) reported a draw of 4.079 million barrels in United States crude oil inventories, compared to more modest analyst expectations that inventories would draw only 756,000 barrels for the week ending September 29. Gasoline inventories, on the other hand, delivered a blow with a larger than expected build of 4.19 million barrels for the week ending September 29, against an expected build of only 1.088 million barrels. Last week, too, saw a large gasoline build.
Payrolls Where Soft Allowing the dollar to Slip
U.S. ADP private payrolls increased 135k in September with the 237k August jump revised down to 228k, to leave the report weaker than expected. There were some effects from the hurricanes, especially in the trade/transport sector, which fell 18k. But it’s also the case that the tight labor market is weighing on hiring. The goods sector added 48 workers, while service sector employment increased 88k, with manufacturing up 18k. Construction jobs climbed 29k, with education also 29k higher. Leisure added 20k.
U.S. ISM Services Hit a 12-year High
The Institute for Supply Management reported that its index of non-manufacturing activity rose to 59.8, which was the highest since the August 2005 reading of 61.3. The latest reading also topped expectations of 55.5. The index was 55.3 the month before.