WIT Crude Oil
Monday has seen crude oil start the week with a little bit of a supportive inventory signal coming out of the United States, although the product balance is less uniform. The latest EIA petroleum report, released on October 15, covers the week ending October 9. EIA reports an 8.6 million-barrel decline in commercial crude stocks to 415.6 million barrels. The Strategic Petroleum Reserve remained at 283 million barrels, with no reported weekly change.
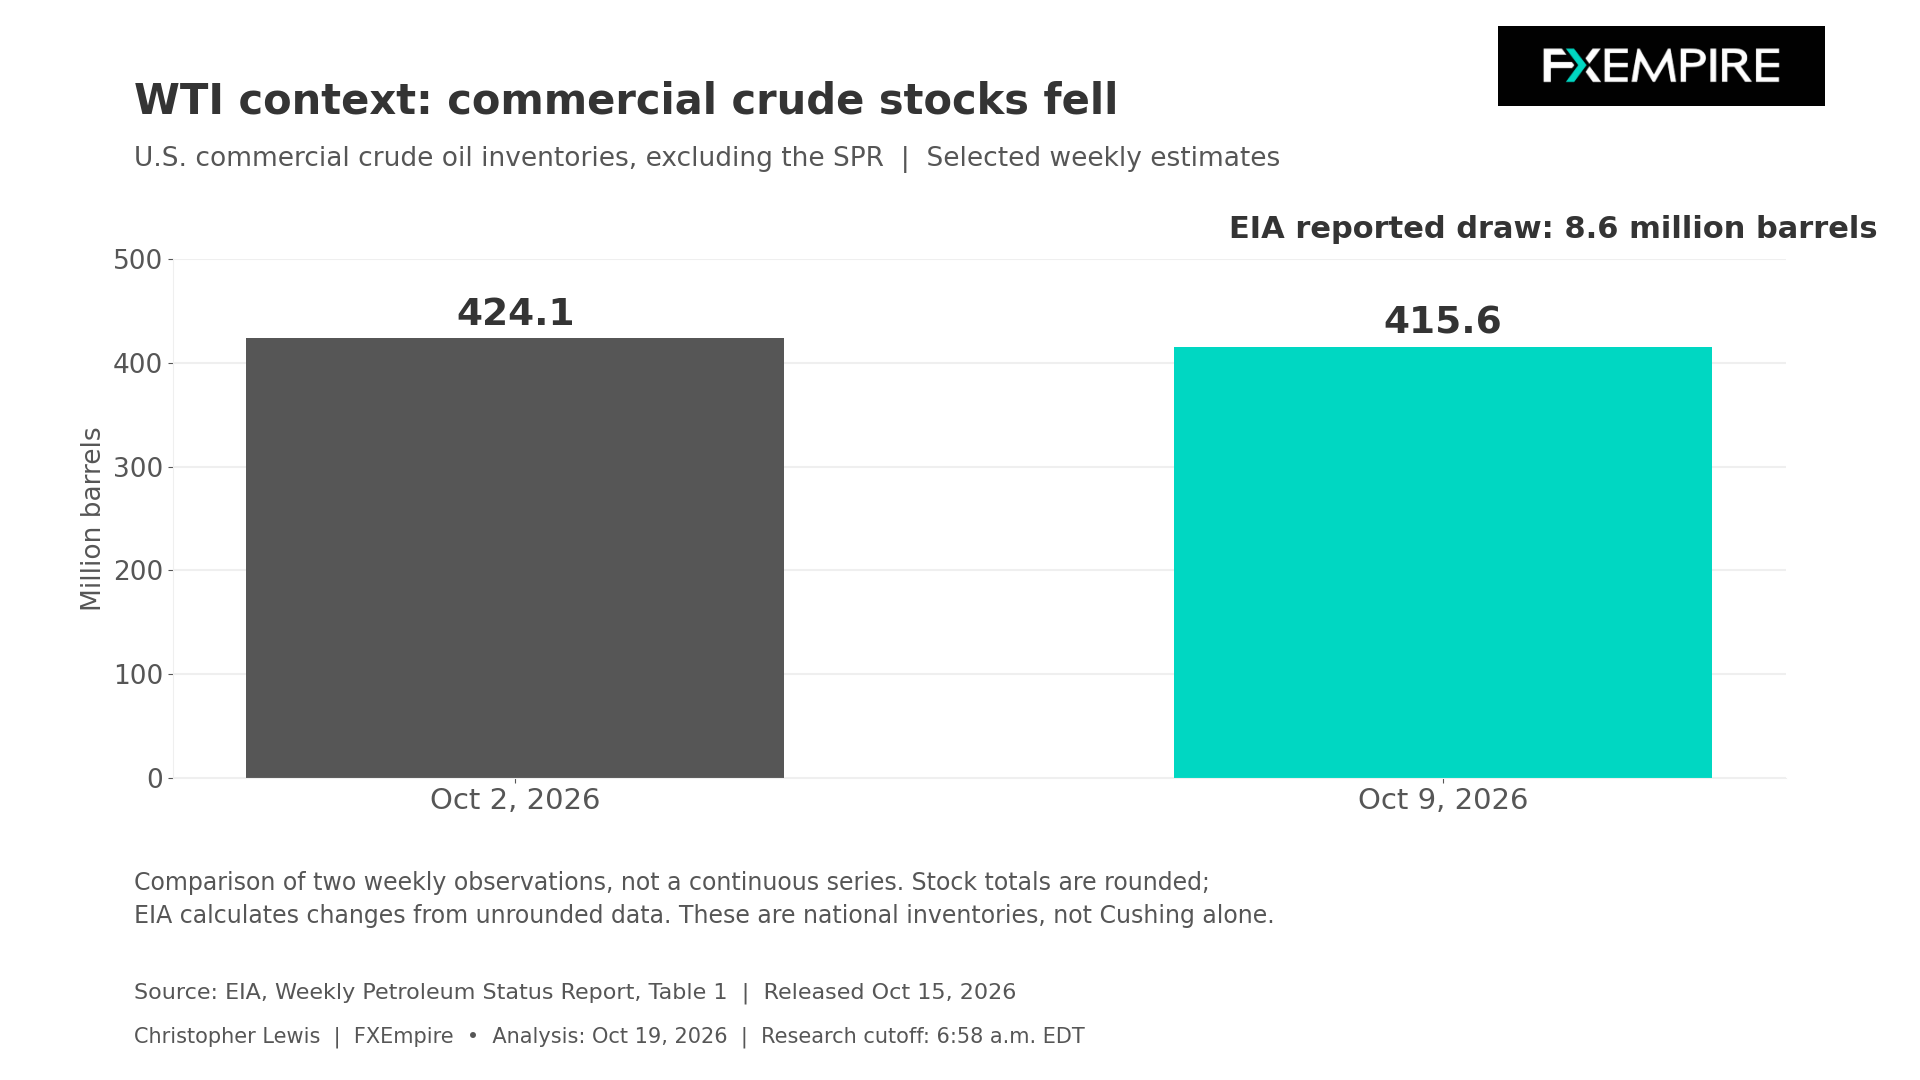
The commercial draw, therefore, is not described as a new emergency coming out of the SPR. Reporting dates do matter. Last week’s publication moved to Thursday at noon Eastern because of the federal holiday. These figures are the latest verified weekly balance available rather than a measurement of the conditions over the last couple of days. That being said, the draws from reserves over the weekend weren’t expected to be much of a story.

Refinery Crude Inputs
Refinery crude inputs averaged 16.615 million barrels per day, compared to 16.48 million the previous week. Domestic crude production is estimated to have moved down to 13.679 million barrels from 13.979 million the previous week. Both are estimates, not necessarily meaning that operating rates are the same at the moment. Stronger refinery intake alongside lower estimated production help explain why the crude balance deserves attention without assigning the change to one factor over the other.
Products complicate a simple scarcity narrative. Gasoline inventories increased by 3.5 million barrels, while distillate stocks decreased by 2.5 million. That divergence matters because refiners buy crude to produce fuels they can sell. A persistent gasoline build could eventually discourage runs. Continued distillate tightness could provide a bit of a counterweight. The demand implications depend on subsequent consumption, exports, and the economy going forward, not just one week’s inventory change.
The most important question is whether the draw represents a lasting tightening or a temporary interruption in the flow of barrels. Production recovery, import timing, and export demand could change the next balance. The next standard release is scheduled for Wednesday at 10:30 a.m. Eastern and will be watched closely. Repeated crude draws from firm refinery demand would reinforce support. A rebound in supply alongside weaker fuel absorption could weaken that case.
Technical Analysis
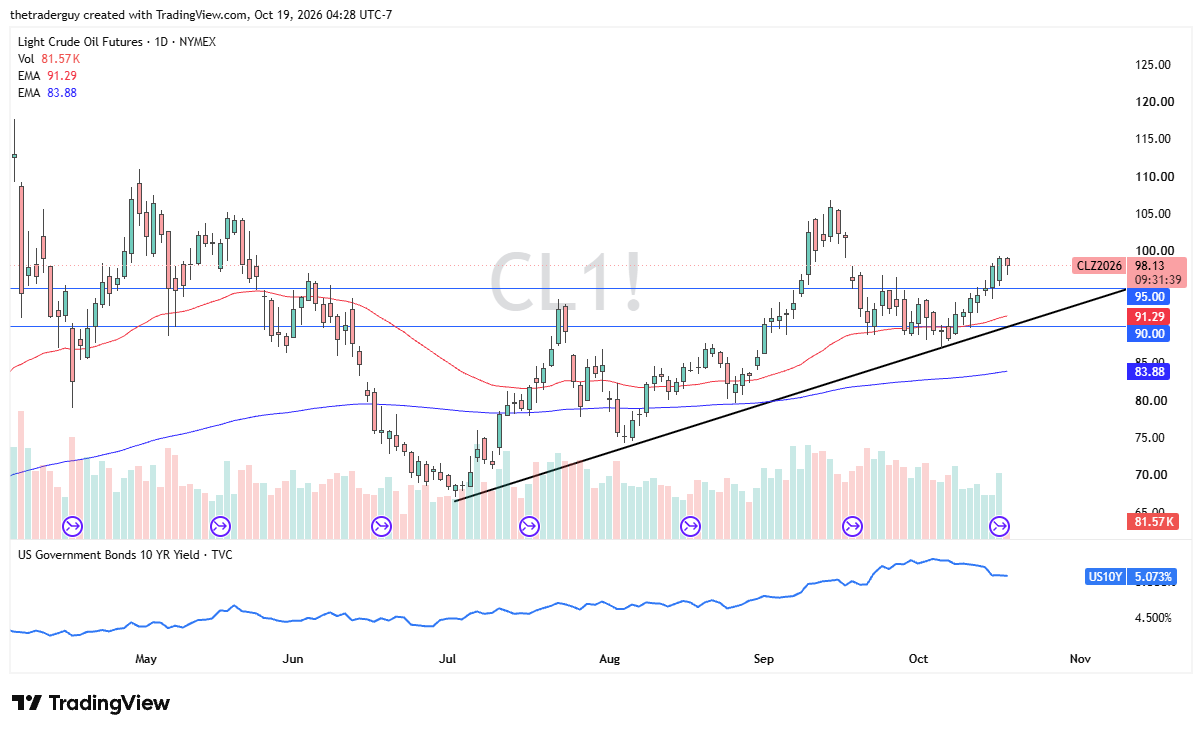
Currently, it looks as if the WTI market has pulled back just a touch during the early part of the trading session on Monday but then has turned around to show signs of life. The $100 level above continues to be an area of significant psychological resistance, and a break above that level could bring in more buyers.
Brent Oil Price Forecast
Every new Brent Oil analysis as it publishes, today's technical signal and key levels, live price — on one page.
See all Brent Oil forecastsBrent Crude Oil
Brent’s international backdrop contains compelling and competing supply and demand risk. The IEA’s October 14 Oil Market Report estimated that global supply increased by 2.5 million barrels per day in September to 102.3 million, led by Gulf producers. Its assessment described the recovery as fragile, though, and the markets will, of course, be watching whether or not that expands.
At the same time, the agency forecast that oil demand would decline by 2.5 million barrels per day year over year in the fourth quarter. This is a forecast, obviously, and is subject to change. Constrained availability and expensive fuel can support and prompt physical markets while also damaging consumption. Refining is the link between the two forces.
IEA Global Refinery Throughput
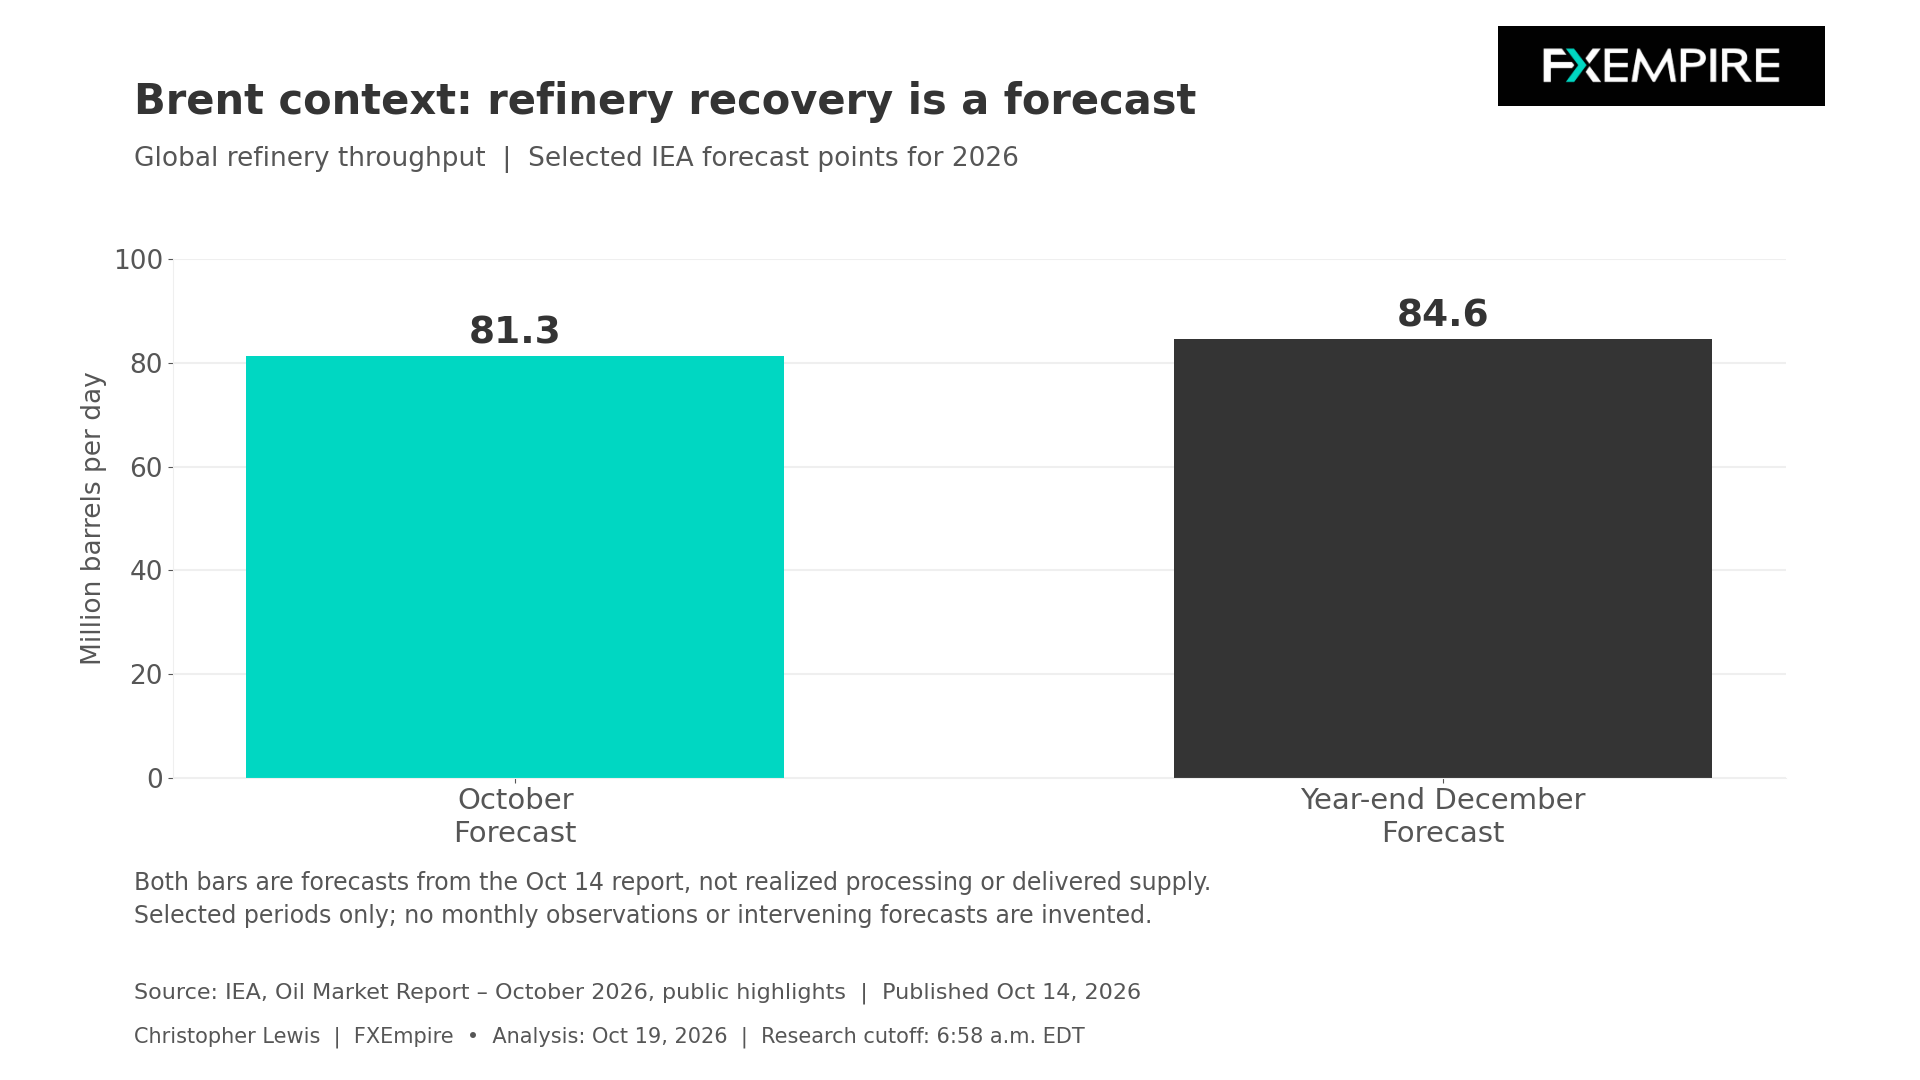
The IEA projected global refinery throughput of 81.3 million barrels per day in October, recovering to 84.6 million by year-end. If runs recover, crude demand could strengthen while consumers face high product costs. If recovery disappoints, crude availability and fuel availability could move in different directions.
OPEC+
OPEC+ policy also needs to be thought of in specific terms. Seven participating countries agreed on October 4 to maintain September-required production levels for November, with their next meeting set for November 1. That is a production policy decision, not proof that every country has produced the required volume or successfully exported it.
For Brent, verified changes in shipping access, delivered supply, and refinery throughput would therefore carry more weight than an unconfirmed geopolitical headline. Higher transport costs can be altering delivered economics, but this report does not assign a fresh freight or insurance premium without an official measurement. While the WTI U.S. stock draw is relevant through trade connections, it does not establish the same degree of tightness in every international crude grade, such as Brent.
Technical Analysis of Brent
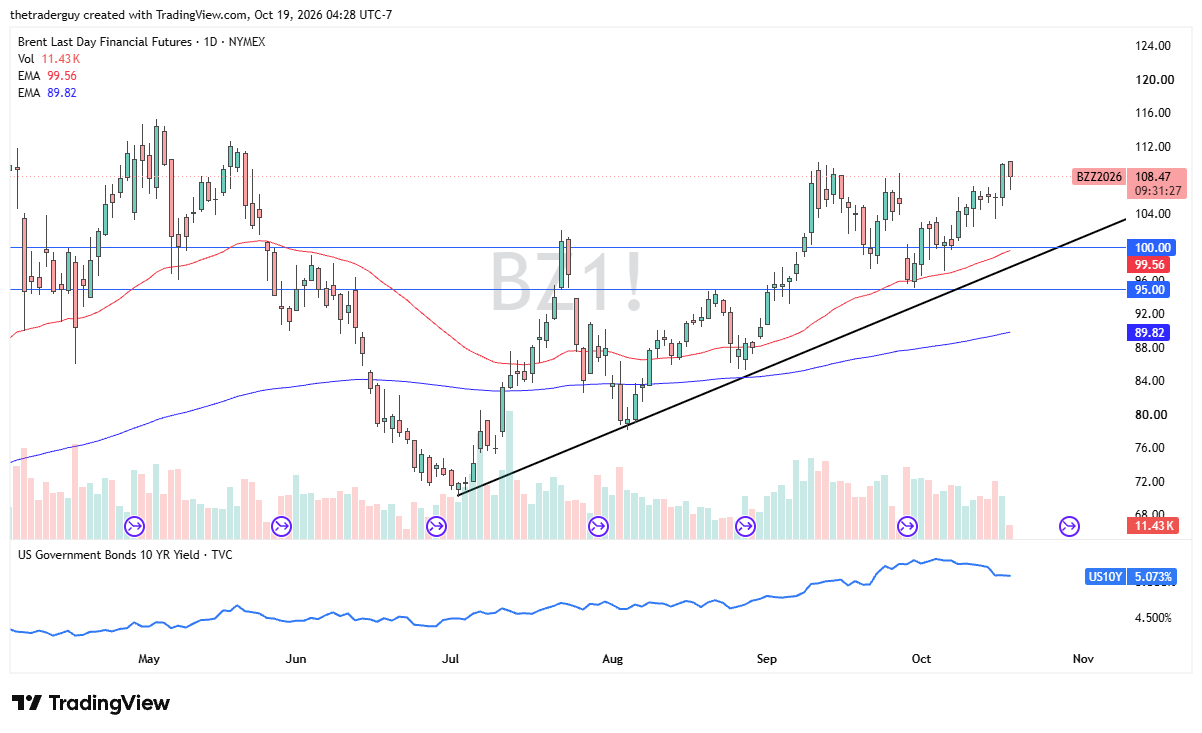
Recently, we’ve seen Brent rallying quite a bit. It has pulled back from an initial gap higher, only to find buyers once it got close to the $107 level, and currently is threatening a breakout to the upside after a pullback several weeks ago. Brent still carries a premium to WTI crude oil, mainly due to the transportation and logistics issues that accompany it. As things stand right now, I still look at this as a buy-the-dip type of scenario.