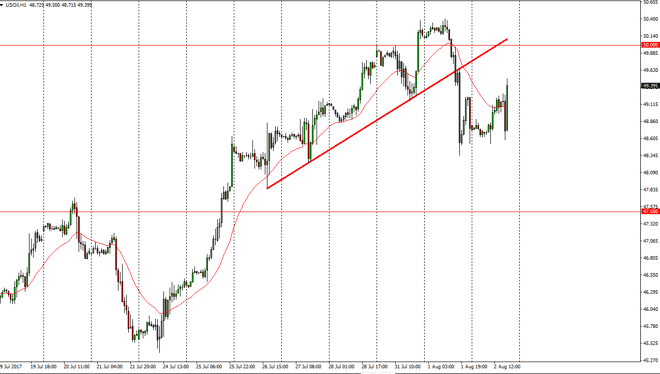
WTI Crude Oil The WTI Crude Oil market was very volatile during the session as we got a mixed number coming out of the Crude Oil Inventories announcement.
The WTI Crude Oil market was very volatile during the session as we got a mixed number coming out of the Crude Oil Inventories announcement. Because of this, I think the market is still a bit confused, but it’s not until we break above the $50 level that I think it’s a market that can be bought. This is because I can also see that the previous uptrend line on the hourly chart could offer a significant amount of resistance as it coincides with $50. Ultimately, I think this market continues to be very difficult to trade, as there are a lot of moving pieces. I tend to feel a bit more bearish when it comes to crude oil, but I would be a seller at higher levels. If we do break to a fresh, new high, and then I think we go looking for the $52.50 level.
Brent markets look very much the same, as we broke above the $52 handle. The uptrend line being broken on the hourly chart was a very negative sign, so I think that there is a significant amount of fear just waiting to happen. I’m a seller on exhaustive candles, as the market should go looking towards the $51 level, and then perhaps the $50 level. If we break to a fresh, new high, then I think that the market probably goes looking towards the $55 level as its next target. It’s going to be a very difficult market to trade, as there are a lot of bets in both directions, but I recognize that no matter what happens, if price rises far enough, production will pick up yet again. Because of this, I am still longer-term bearish, but recognize that we are seeing short-term bullish pressure. I am personally going to be very patient and wait for selling opportunity but I do recognize that short-term traders may be able to pick up a bit of profit to the upside.
Chris is a proprietary trader with more than 20 years of experience across various markets, including currencies, indices and commodities. As a senior analyst at FXEmpire since the website’s early days, he offers readers advanced market perspectives to navigate today’s financial landscape with confidence.