


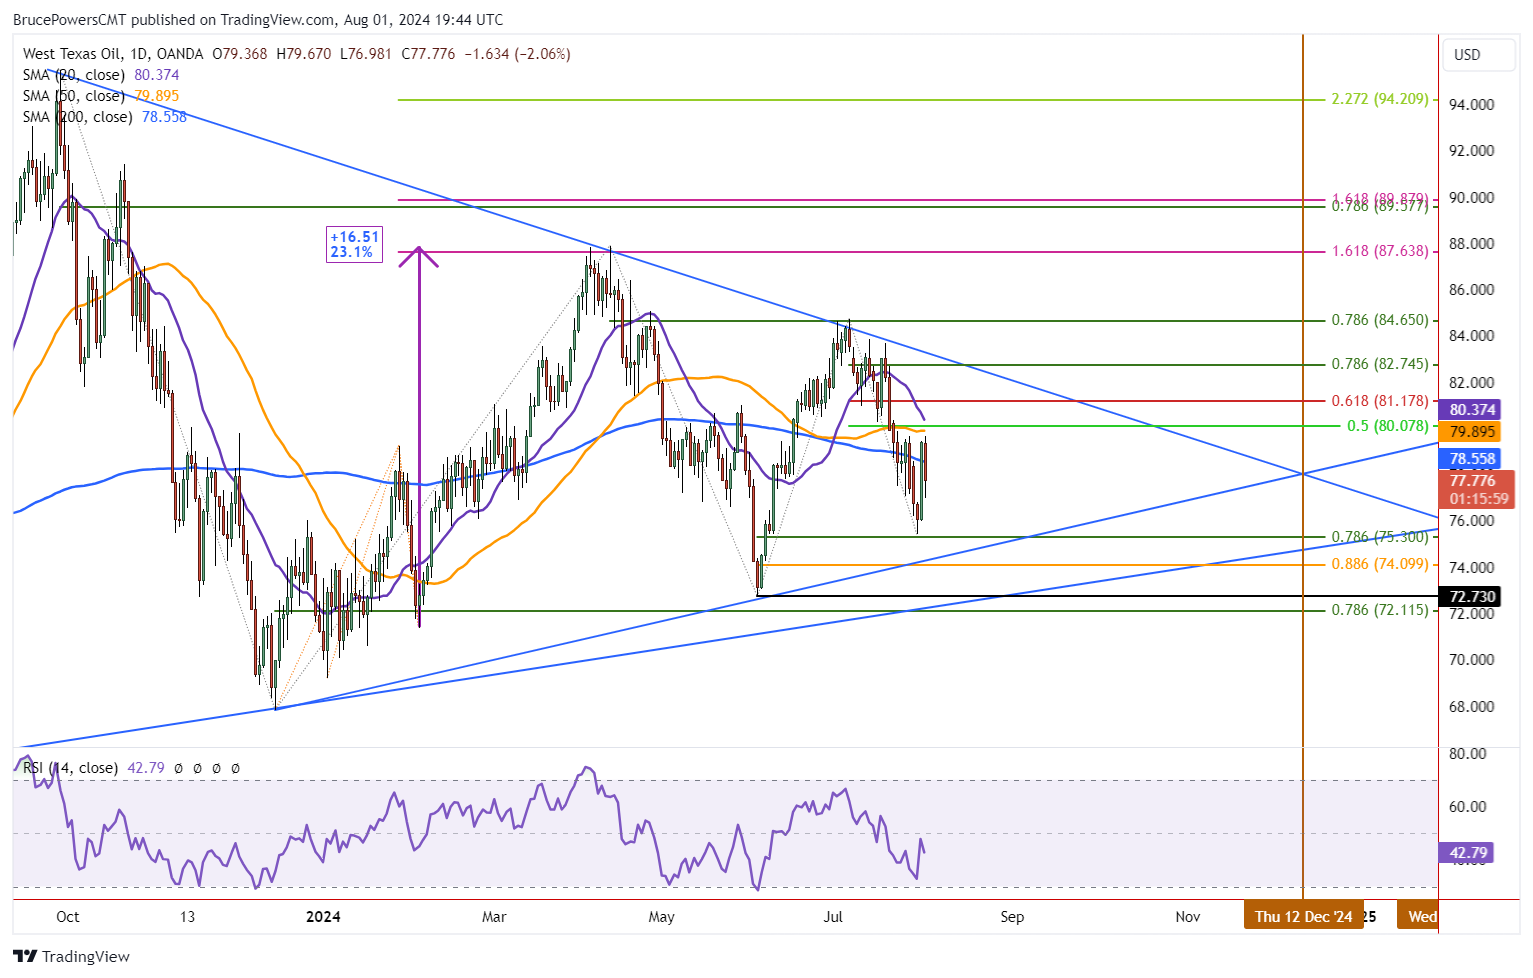
Crude oil found resistance on Thursday at a high of 79.67 before it turned down. That was another test of resistance around the 50-Day MA. Notice that the 50-Day MA has marked an area of resistance for the past since July 22. Therefore, a breakout above the 50-Day line at 79.89 for a sign of strength that may be sustainable. This week’s high was 79.67 and it is an earlier pivot for signs of strength. Since this week is not yet over, the high for the week could change.

Signs of a Possible Bottom Remain
A 78.6% Fibonacci retracement looks to have been completed on Tuesday as it was followed by a daily bullish reversal. Given the bullish reaction from support, it is likely the correction is complete. Of course, a drop below the swing low at 75.42 would indicate that is not the case and lower prices will likely be tested support.
Large Symmetrical Triangle Formation
The swings in crude have been narrowing over the past six months or so it as traces out a symmetrical triangle formation. This is a consolidation pattern that encompasses a generally choppy trading environment. This needs to be considered currently as the trading range in crude has continued to narrow. As crude progresses towards the apex of the triangle it gets closer to breaking out. The apex of the full triangle is in February 2025, however there is an internal triangle as well that ends in December.
Unless there is a decline below the June swing low at 72.73 the expectation is that gold will likely resolve itself to the upside eventually, with a bullish triangle breakout. If so, it could make a new attempt with the current developing rally from Tuesday’s swing low at 75.41. It is possible that the low was the best price before an upside breakout.
Breakout Above 79.67 Points to Higher Prices
This week’s high was 79.67 and last weeks was 80.35. An advance above each of those price levels will indicate strengthening in the price of crude oil and signal an upside breakout that could lead to higher prices. However, keep in mind the 50-Day line at 79.89. There is also the 20-Day MA at 80.38 and there might be signs of resistance around that line. Nonetheless, it is an important potential pivot level.
WTI Crude Oil Price Forecast
Every new WTI Crude Oil analysis as it publishes, today's technical signal and key levels, live price — on one page.
See all WTI Crude Oil forecastsFor a look at all of today’s economic events, check out our economic calendar.



