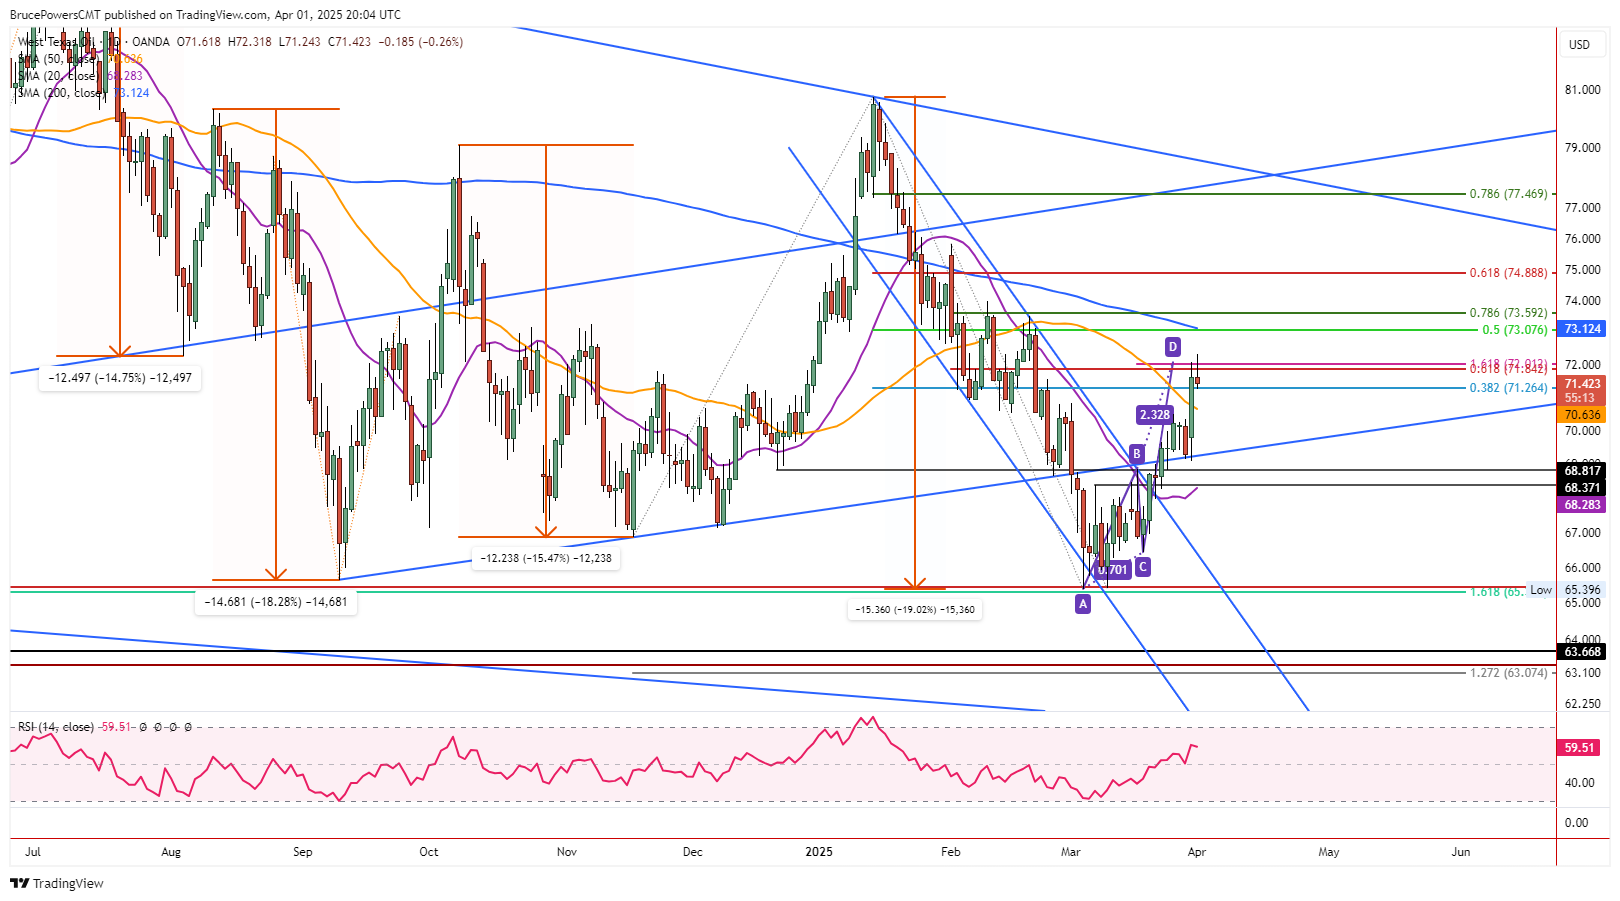
Crude oil rallied and overshot Monday’s high of $72.07 briefly on Tuesday to reach a new high of $72.32. Resistance was subsequently seen the crude oil began to weaken intraday. It continues to trade near the lows of the day, currently $71.34, at the time of this writing, and it is on track to close in the lower third of the day’s trading range. If it does so, a bearish shooting star candlestick pattern will be established.

Resistance Seen After Targets Hit
During Monday’s advance to a high of $72.07, a 61.8% Fibonacci retracement of an interim downswing, was completed at $71.84, and the 161.8% extended target for a rising ABCD pattern was reached at $71.01. Signs of strength were shown with a reclaim of the 50-Day MA and a breakout above the 31.2% Fibonacci retracement level at $71.26. The ABCD pattern target is 161.8% of the price appreciation seen in the first leg up of the pattern, labeled AB. It reflects a harmonic relationship between the two swings based on price. Once that occurs there is a greater potential for resistance to be seen.
New Trend High Fails
Notice that the ABCD pattern target was almost an exact match with Monday’s high. Moreover, observe that Monday’s strong 3.37% advance was preceded by an undercut of the prior day’s low and a successful test of support at a lower trendline. That is when buyers took back control and drove the price above the highs of the previous three days.
The line represented resistance previously as shown by an interim swing high (B). This type of behavior before a strong move is not unusual. Therefore, it is a pattern of behavior that will likely be seen again either in crude oil or other financial assets.
50-Day MA Support is Key
Although it looks like crude oil could keep climbing to the next higher price target, the fact that two targets mark a resistance zone and there is a bearish daily pattern, suggests a pullback first. A breakdown below today’s low of $71.34 will trigger the bearish shooting star pattern. The 50-Day MA is currently at $70.64 and it now represents a key potential short-term support area. Higher targets for crude oil include the confluence of the 200-Day MA, now at $73.13, and the 50% retracement at $73.08.
WTI Crude Oil Price Forecast
Every new WTI Crude Oil analysis as it publishes, today's technical signal and key levels, live price — on one page.
See all WTI Crude Oil forecastsFor a look at all of today’s economic events, check out our economic calendar.