


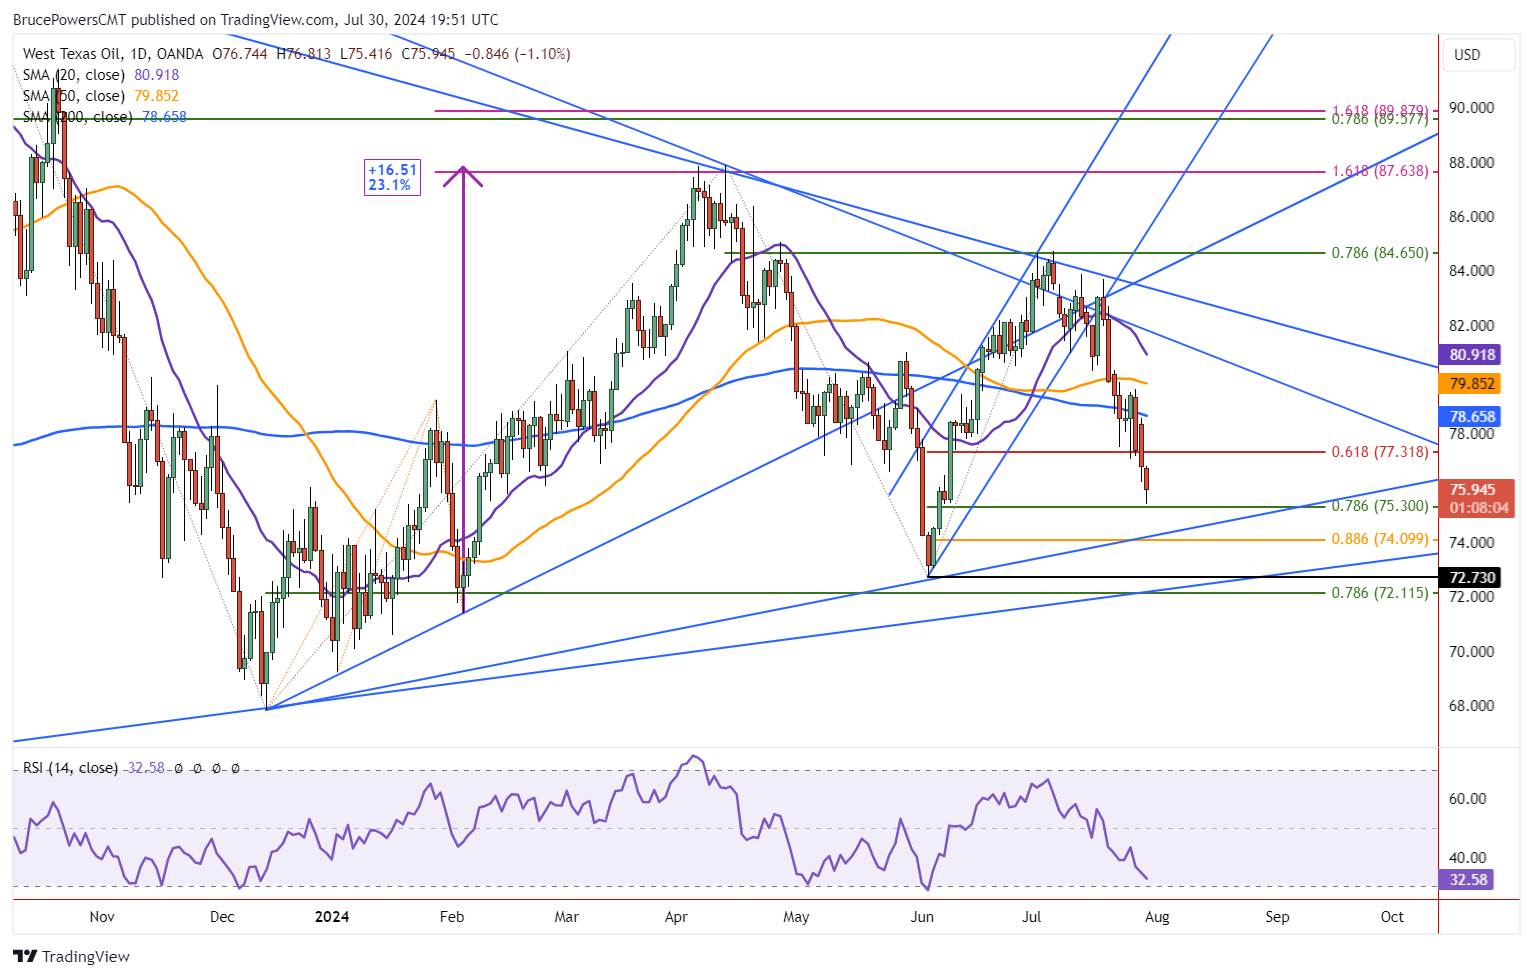
A bearish correction in crude oil continued Tuesday, with crude falling to a new retracement low of 75.42, at the time of this writing. Previously, the price area around the 61.8% Fibonacci retracement at 77.32 retained support for four days last week. Yesterday, crude broke to the downside and the decline continues today. Crude oil looks to be heading to test support around the 78.6% Fibonacci retracement at 75.30. If it fails to hold as support, then the lower internal uptrend line is the next lower target. It can be watched along with the 88.6% Fibonacci retracement level at 74.10.

Moves Closer to a Solid Bottom
Although the expectation for a completion of the bearish retracement last week has failed, today’s decline shows crude oil getting closer to completing the pullback. It has been stuck within a large developing symmetrical triangle consolidation pattern for over six months and the bearish trend continuation this week extends the time for a potential breakout of the pattern. As crude gets close to the apex of the triangle, the closer it gets to a breakout. This makes the upcoming retracement low a possible early entry for an eventual upside breakout of the triangle pattern.
Of course, a bearish breakdown is always a possibility but there is some technical evidence pointing to an eventual upside breakout. Investors will be watching for an upcoming bottom closely as it may provide the best risk versus reward entry for a potential upside bullish breakout. Nonetheless, some will find a rally to test higher price levels within the consolidation pattern also attractive.
Monthly Chart Shows Correction Likely Resolved to the Upside
The more compelling argument for an eventual upside breakout of the triangle comes from the monthly chart (not shown). It shows support congregating around the 200-Month MA since it was hit as support in December 2022. Last month was almost an exact retest of the 200-Month line as support. The low for the month was 72.73 and the 200-Month line was at 73.12.
That’s close for a monthly time frame. Crude strengthened off that low. Further, the 50-Month MA gave a bullish signal last month as it crossed above the 200-Month line. Moreover, there was a bullish reversal signaled this month as crude rallied above June’s high of 83.02 earlier this month. This month’s low remains above June’s low of 72.73.
WTI Crude Oil Price Forecast
Every new WTI Crude Oil analysis as it publishes, today's technical signal and key levels, live price — on one page.
See all WTI Crude Oil forecastsFor a look at all of today’s economic events, check out our economic calendar.



