


Crude Oil Tests Double Bottom Breakout
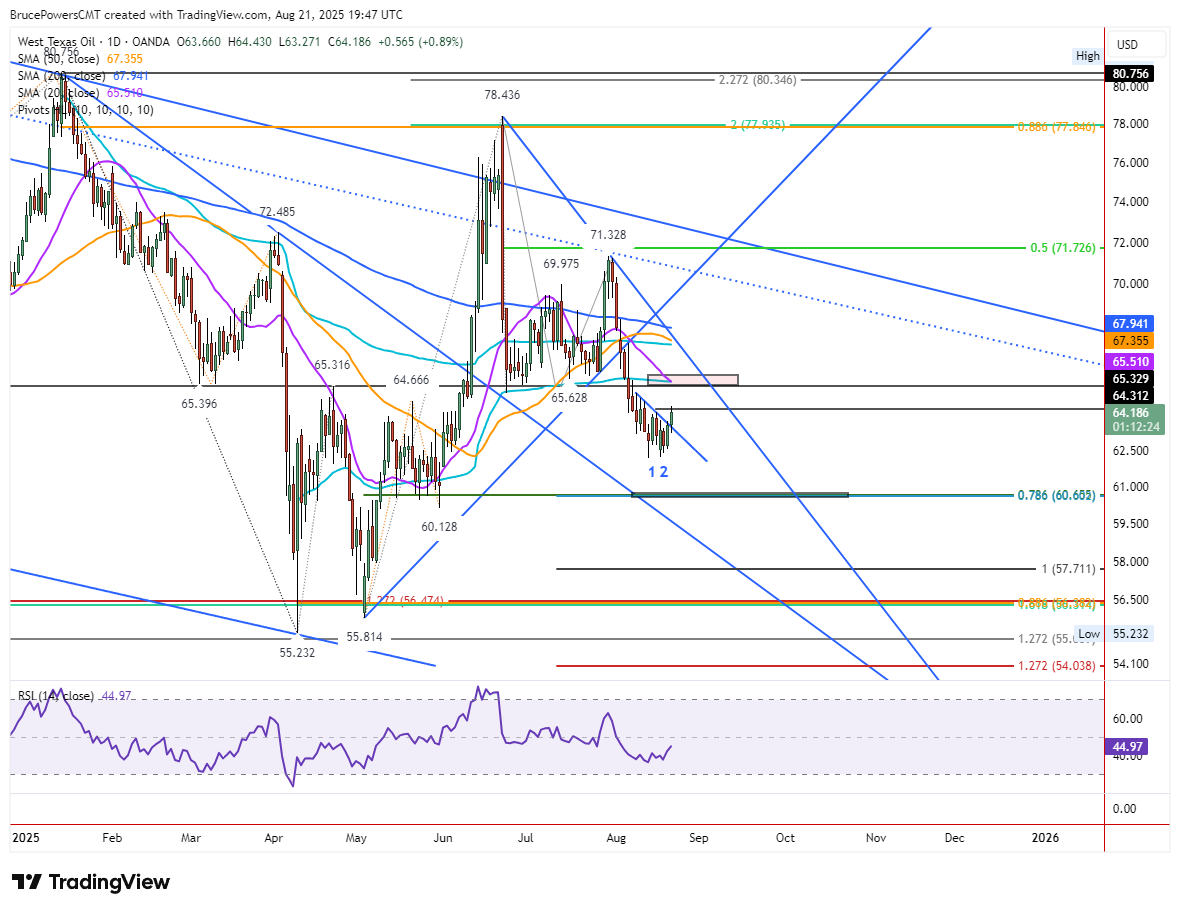
Crude oil made an initial attempt to break out from a small double bottom bullish reversal pattern on Thursday, reaching a high of $64.43. A breakout above a short downtrend line triggered early in the session, showing strength, followed by a move above the pattern’s neckline at $64.18. However, the bullish breakout is not confirmed until there is a daily close above the neckline.
The day’s high marked a seven-day high, and crude is on track to finish near the highest daily close in eight days. If it closes above $64.32, it will represent the highest close in nine days, signaling further short-term bullish momentum.
Short-Term Strength and Key Resistance
Demand remains strong as trading continues near the highs of the day, suggesting the session high could still be extended. Thursday’s long-range green candle and likely close near session highs set the stage for a potential confirmation of the double bottom breakout. If confirmed, the next area of resistance comes into focus around the 20-Day moving average at $65.41.
This zone is reinforced by a large double bottom neckline, prior support and resistance near $65.32, and an anchored volume-weighted average price (AVWAP) calculated from the April trend low. Together, these levels form a potential resistance zone ranging roughly from $65.02 to $65.41.
Weekly and Longer-Term Outlook
Last week’s high at $64.77 was another key level. A sustained move above it would trigger a bullish reversal on the weekly chart, opening the door to further strength. Should momentum continue, a rally above $65.52 would position crude oil to test higher price levels, including the 50-Day moving average at $67.46 and the 200-Day moving average at $67.94.
Conclusion
Crude oil is showing signs of strengthening demand and short-term bullish momentum, but the double bottom breakout remains conditional on a daily close above $64.18 and the upside may be limited. Confirmation of the pattern would target the 20-Day moving average and potentially higher resistance levels, setting the stage for further upside in the days ahead.
WTI Crude Oil Price Forecast
Every new WTI Crude Oil analysis as it publishes, today's technical signal and key levels, live price — on one page.
See all WTI Crude Oil forecastsFor a look at all of today’s economic events, check out our economic calendar.