


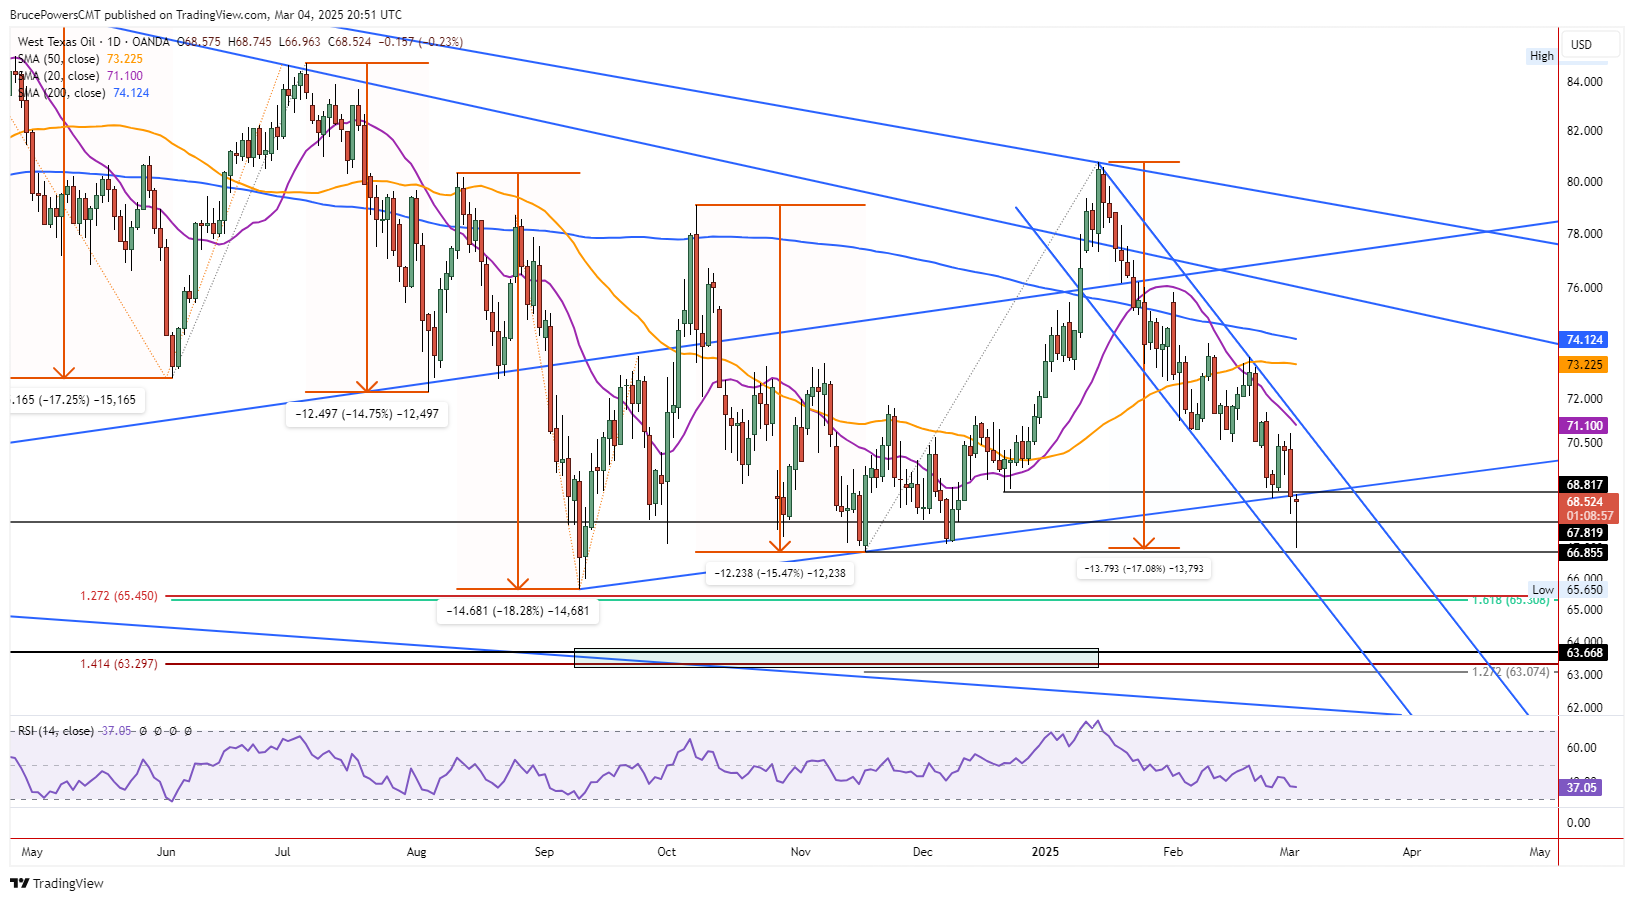
Crude oil extended its bearish correction on Tuesday to a new trend low of $66.96. Subsequently, buyers took control and drove the price up to new highs for the day. At the time of this writing, crude oil hit a high of $68.66 for the day as it tested resistance around a trendline that marked the bottom of a prior consolidation phase.
Notice that the market recognized the line on the way down as support was seen at the line last Wednesday and it was followed by a bounce. Crude oil continues to trade near the high prices of the day and may complete a bullish dragonfly doji or hammer candlestick pattern if it remains in a similar position at the close of the session.

Breakout Above Tuesday’s High
A decisive breakout above today’s high would trigger a one-day bullish reversal breakout and put crude in a position to challenge higher trend resistance areas. The potentially more significant resistance zone is first around the 20-Day MA, now at $71.11.
For crude to have a shot of going higher and potentially reversing the bearish trend it needs to first get above and stay above the 20-Day line. That moving average can be viewed along with the downtrend line marking dynamic resistance for the decline. A decisive breakout above the line would put crude in a position to challenge potential resistance around the 50-Day MA, which is $73.23 currently.
Bounce off Monthly Support
It is important to consider several key factors when addressing support at the daily low point. Support was seen near an interim swing low of $66.86 from mid-November, and near the lower channel line for the current decline. That November support level was also a monthly low. Although the lower line was not hit specifically, the correction got close enough given the subsequent bullish reaction.
Moreover, a measured move for the correction shows a $13.79 or 17.1% decline from the most recent swing high at $80.76. The four prior bearish corrections in crude oil ranged from a decline of 14.8% to 18.3%. Since the current decline was close to matching the largest recent drop on a percentage basis, it provides another piece of evidence to support the likely completion of the correction. The fact that a sharp intraday bullish reversal followed further supports this thesis.
WTI Crude Oil Price Forecast
Every new WTI Crude Oil analysis as it publishes, today's technical signal and key levels, live price — on one page.
See all WTI Crude Oil forecastsFor a look at all of today’s economic events, check out our economic calendar.


