



Crude oil prices dropped sharply on Wednesday and consolidated at lower levels as the increase in inventories increased concerns about excess supply. WTI oil dropped to $81 while Brent oil dropped near $92. The market focuses on the growing stockpiles as compared to the risk of supply from the conflict in Iran which leaves prices vulnerable to further losses as inventories continue to increase.
The US Energy Information Administration reported an increase of 3.4 million barrels in crude inventories. The stocks for gasoline also increased by 5.2 million barrels.
The primary risk to oil prices still comes from the risk of shipping in the Strait of Hormuz. ADNOC L&S said that one crew member remained missing and 11 were injured after the attack on the vessel on Tuesday. This suggests that there is still risk to shipping in the region. If these attacks continue, it may delay the deliveries and increase the cost of transport.
In my view, the outlook for crude oil still remains uncertain due to the uncertainty in the region which may create volatile ranges in both directions. But the direction remains negative in the short term.
WTI Crude Oil Price Forecast: Break Below $87 Points to $78–$80
The daily chart for WTI crude oil shows that the price has been consolidating within the triangle pattern since the beginning of US-Iran war. The edges of this triangle are now approaching the $102 and $78 regions.
WTI oil formed the double top pattern as the price hit the resistance of this triangle. This double top was formed with high of $106.75 on 15 September and high of $104.99 on 30 October. The neckline of this double top pattern was broken at the $87 area, which suggests negative price action in the short term.
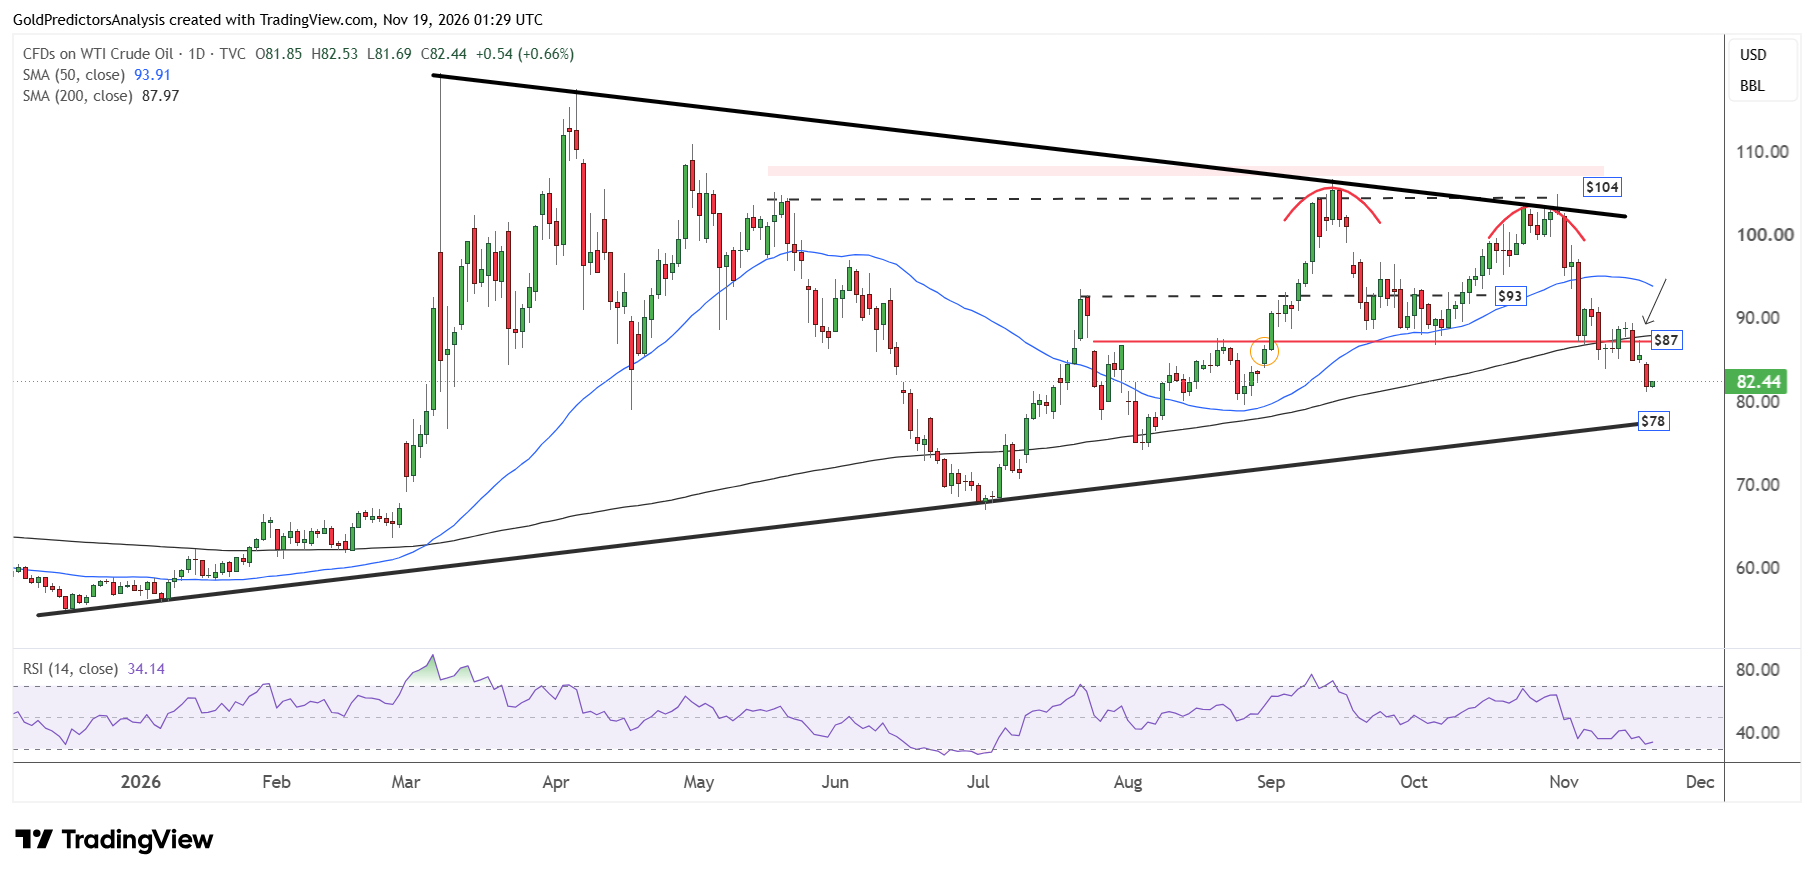
The lower boundary of the triangle pattern now remains at the $78 level, which is considered strong support in the short term. The price has broken below the 200-day SMA at the $87 level, which suggests negative trend in the short term. The RSI also remains below the midline and continues to drop.
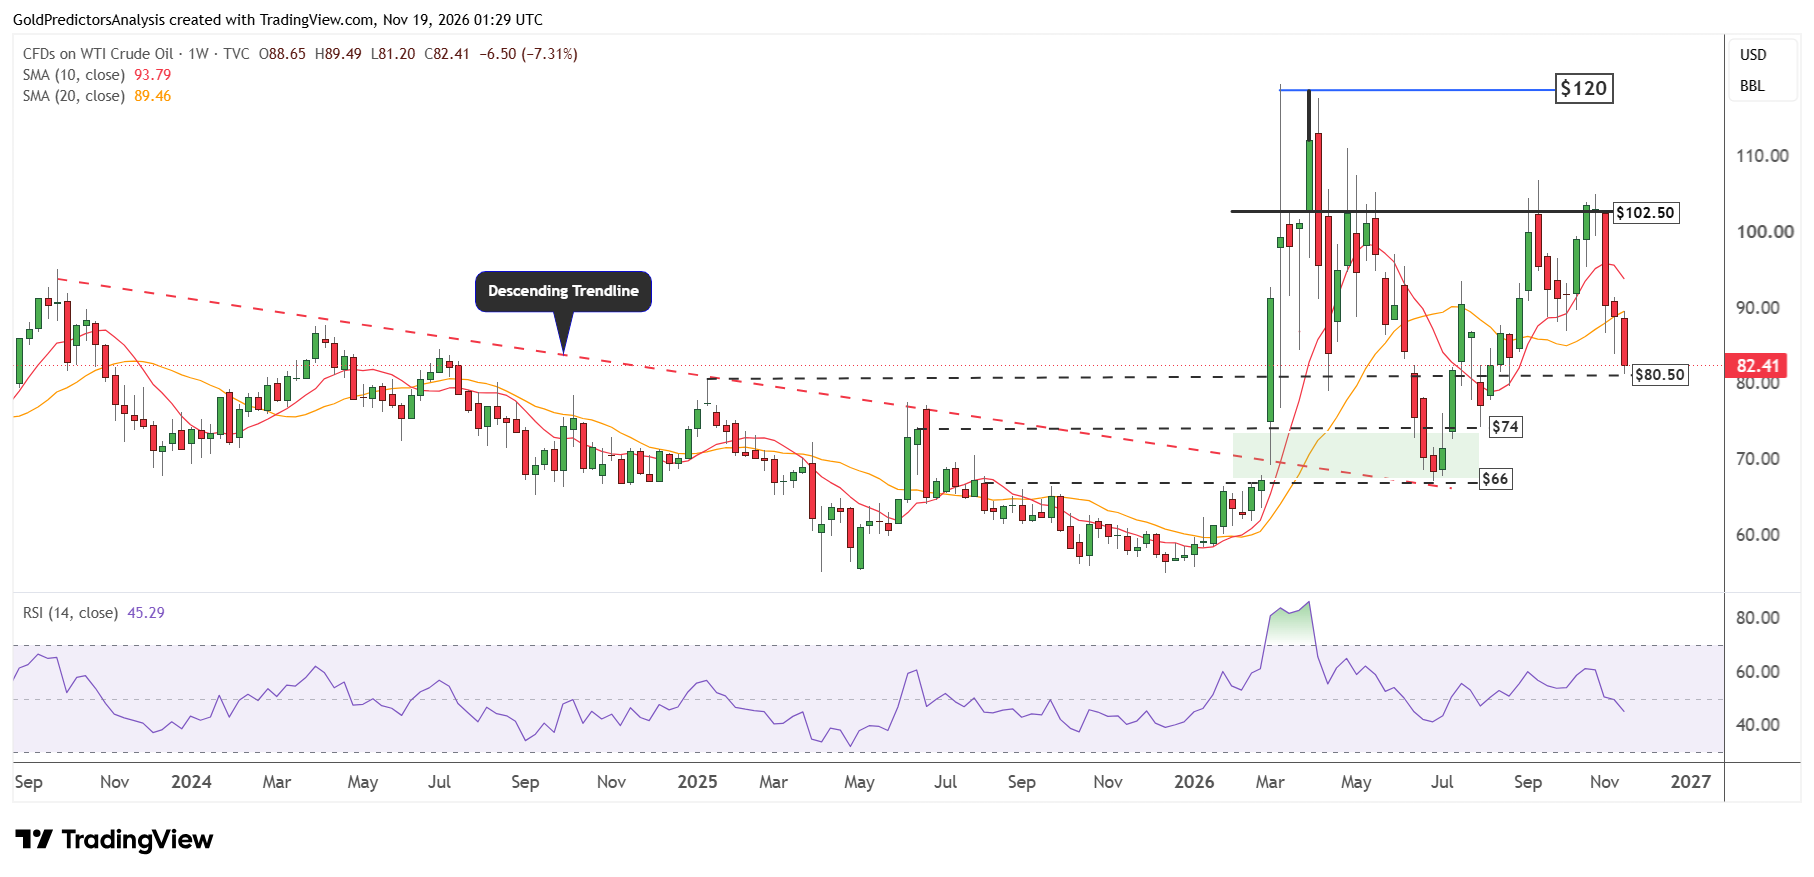
The weekly chart for WTI crude oil shows strong volatility in the oil market since March 2026. The price is consolidating between $66 and $120. But the $102.50 to $106 area remains the key region in the WTI crude oil market. This area is defined by the resistance of the descending channel pattern as discussed in previous analysis.
The price has continued to drop during the past three weeks. It is now moving towards key support level of $80.50 in the short term.
The support at $80.50 on the weekly chart also coincides with the support at $78 on daily chart. Therefore, the key support region in WTI crude oil remains at the $78 to $80 area.
Brent Oil Price Forecast
Every new Brent Oil analysis as it publishes, today's technical signal and key levels, live price — on one page.
See all Brent Oil forecastsBrent Oil Price Forecast: Further Losses Could Test $87–$88 Support
The daily chart for Brent crude oil shows that the price failed to break above the $120 area in October. The price dropped after failing to break above $120. The price has already broken below the 200-day SMA and continued to drop.
If the price continues to drop below the $92 level, it will likely move towards red horizontal support line in the $87 to $88 area. But a break below $87 may push the price further down towards the $80 level. This support is defined by the ascending trend line that stretches from lows of December 2025.
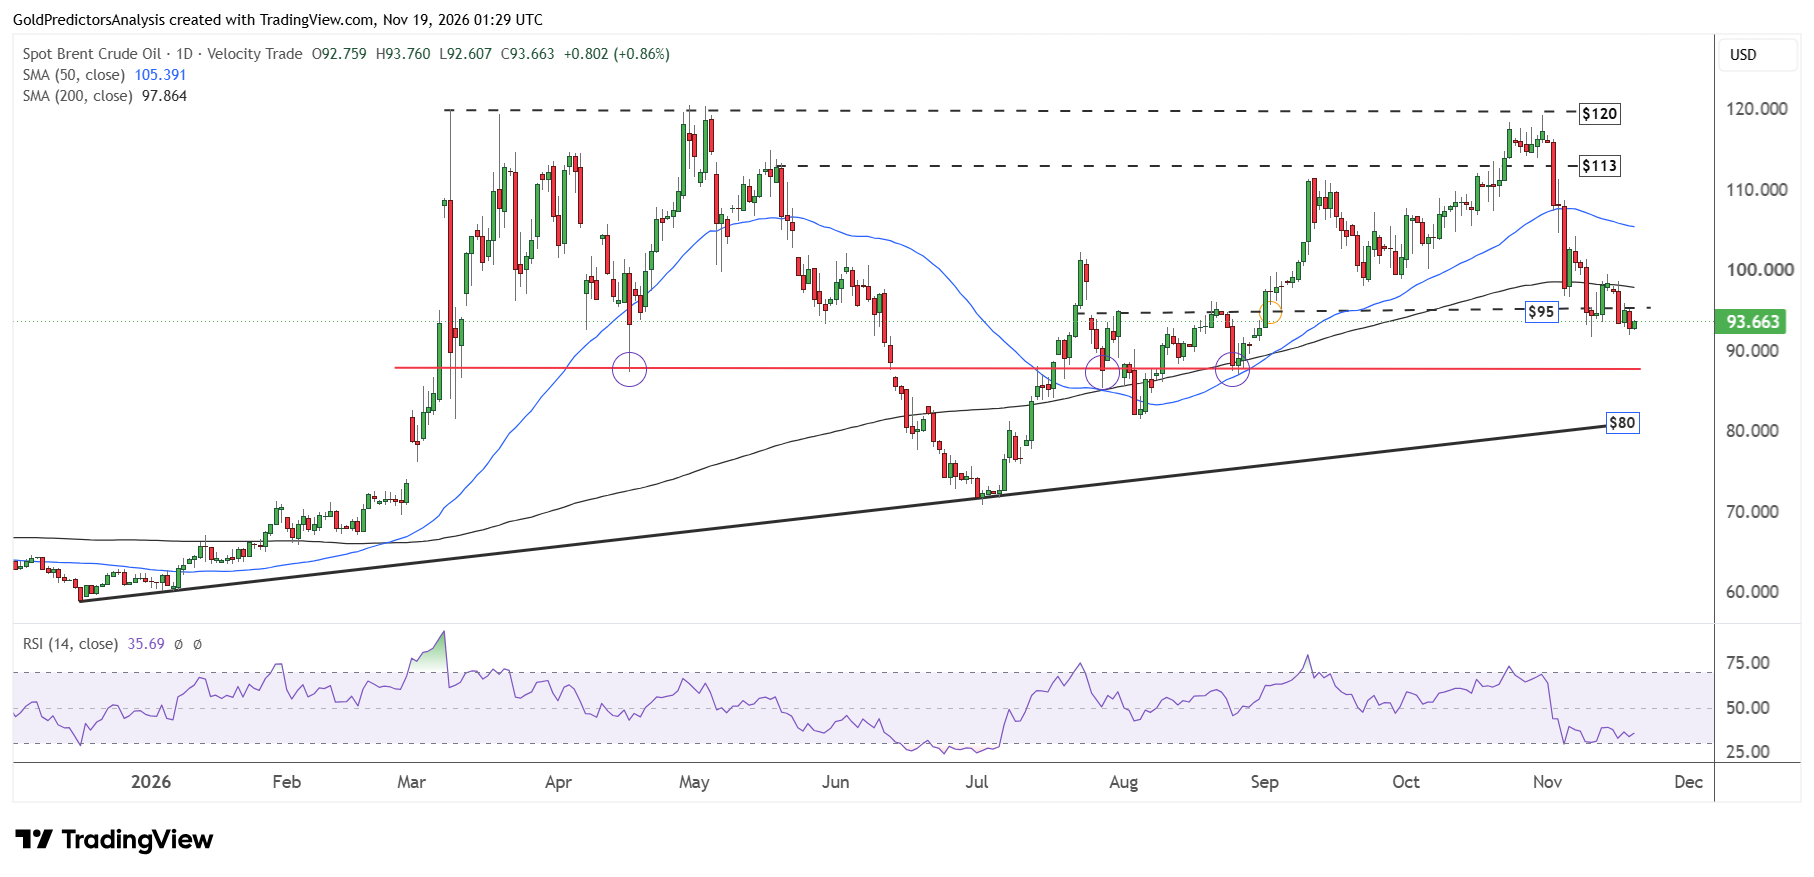
The RSI indicator is consolidating near oversold levels on the daily chart while the price remains below the 50-day and 200-day SMAs. But the 50-day SMA remains above the 200-day SMA which shows mixed signals on the technical charts.
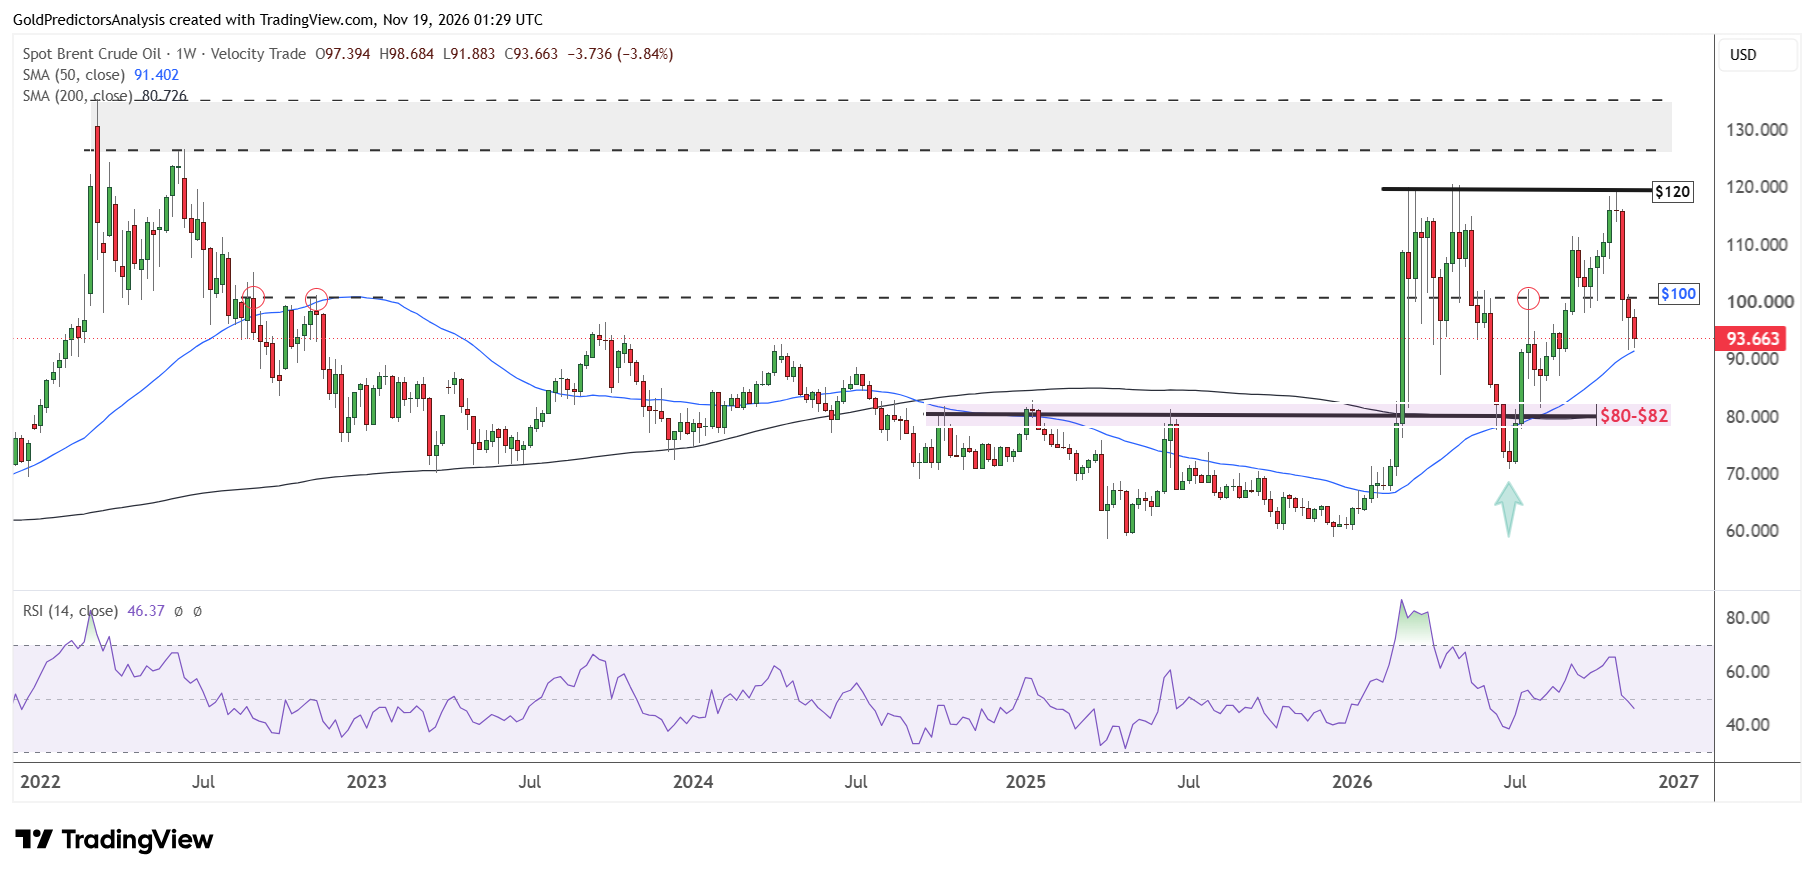
The weekly chart for Brent oil also shows that the price has broken below the $100 mark. The price is now moving towards the 50-week SMA at the $91.40 level. A break below $91.40 will likely open the way for further drop towards the $80 to $82 area. It is interesting to note that when the price closes below 50-week SMA, the RSI will likely break below the midline on the weekly chart.
Bottom Line
In my view, crude oil prices remain in a negative trend in the short term. WTI has broken below $87, which suggests that prices may push towards the zone of $78-$80. On the other hand, Brent oil prices also remain weak and could move towards $87-$88. However, the oil market still faces risk from shipping in Strait of Hormuz. The risk of shipping disruptions may trigger a sharp rebound in prices. WTI oil needs to recover above $90, while Brent oil must recover above $100 to ease the pressure and trigger a rebound.