



June West Texas Intermediate crude oil futures finished the week slightly lower while posting an inside move. The chart pattern suggests investor indecision and impending volatility. Despite the slight setback, the market remains within striking distance of a recently hit three-year high.
Supporting the market is the possibility of sanctions against Iran. If this occurs, we could see a disruption in supply.
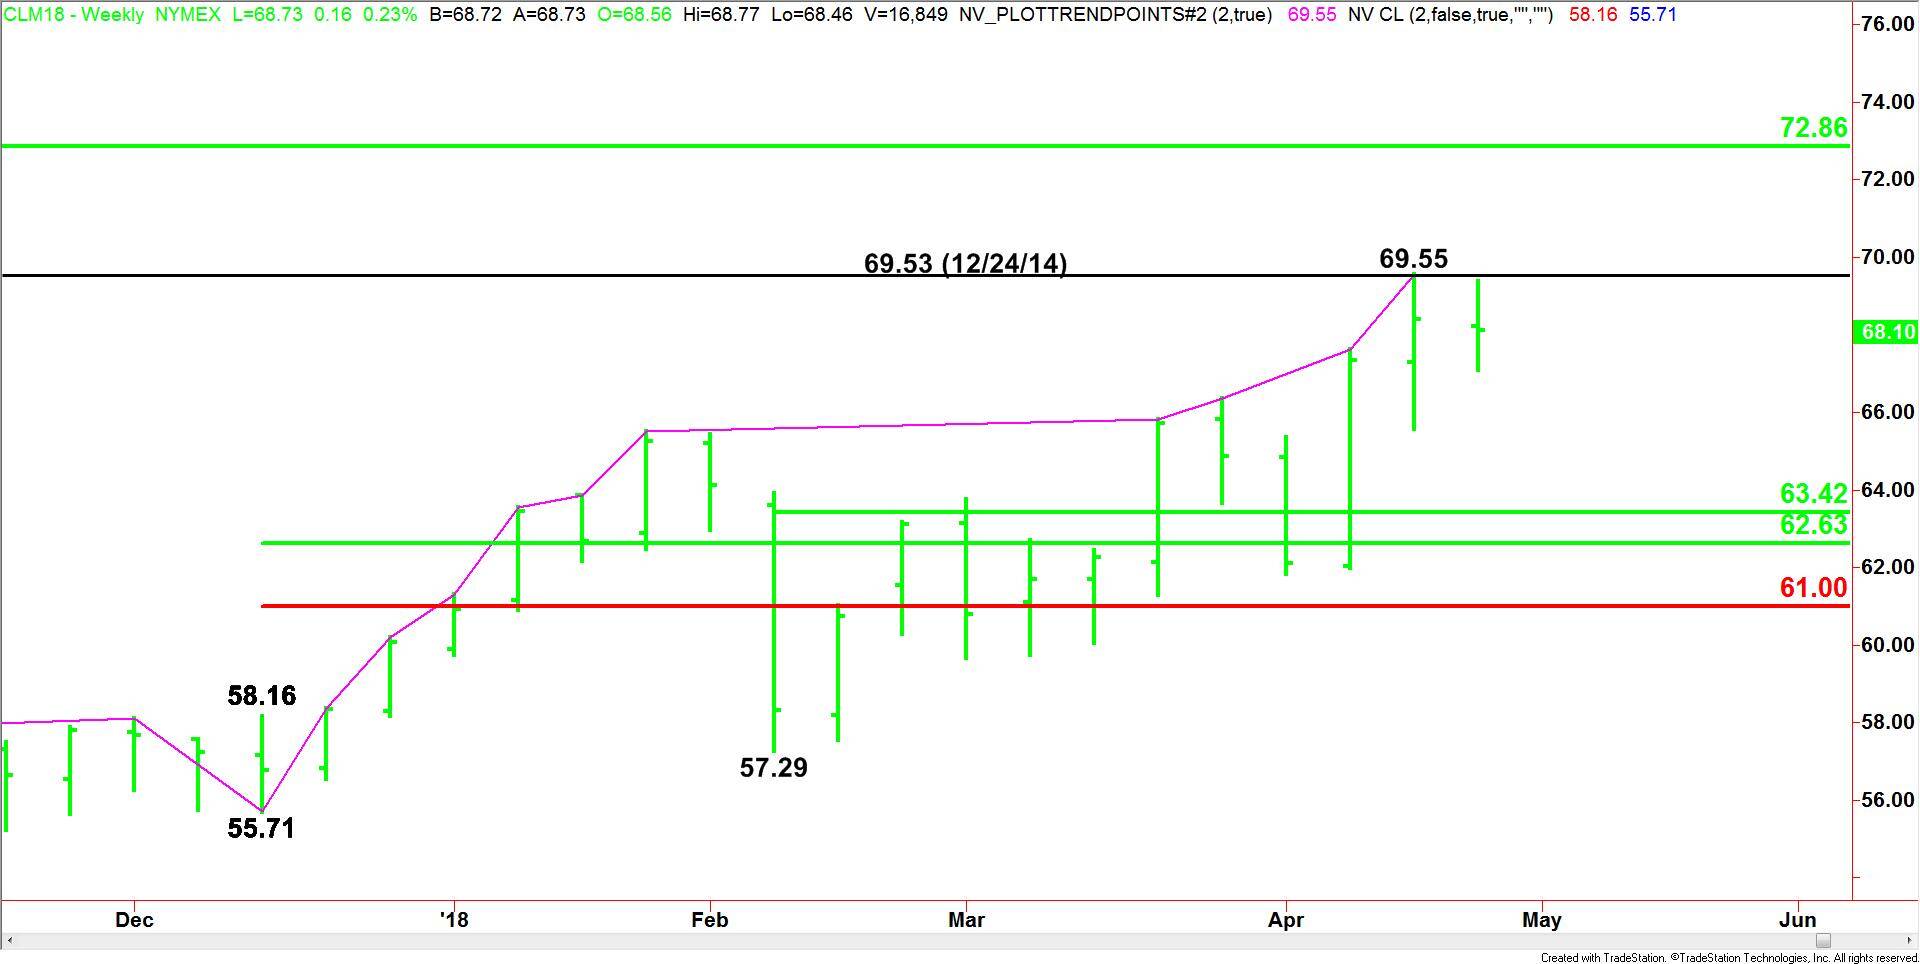
Weekly Swing Chart Technical Analysis
The main trend is up according to the weekly swing chart. A trade through $69.55 will reaffirm the uptrend.
The major upside target is the long-term 50% level at $72.86.
The main range is $55.71 to $69.55. Its retracement zone at $62.63 to $61.00 is support.
The short-term range is $57.29 to $69.55. Its 50% level or pivot at $63.42 is additional support.
Weekly Swing Chart Technical Forecast
Based on last week’s trade, the direction of the market this week is likely to be determined by trader reaction to the last high at $69.55.
A sustained move under $69.55 will indicate the presence of sellers. If this move starts to pick up momentum then we could see a pullback into the pair of 50% support levels at $63.42 and $62.63. Since the main trend is up, buyers are likely to come in on a test of this area.
Overtaking and sustaining a move over $69.55 will signal the presence of buyers. If this move creates enough upside momentum, we could see an eventual test of the major, long-term 50% level at $72.86.
It all comes down to is how investors react to $69.55.