



June West Texas Intermediate Crude Oil futures are trading slightly lower shortly before the release of this week’s U.S. Energy Information Administration’s inventories report. Traders are looking for a 1 million barrel build, but yesterday’s American Petroleum Institute’s report showed a bigger-than-expected build. This is making the longs a little nervous. Losses could be limited by any news about the reimposition of sanctions against Iran.
Daily Swing Chart Technical Analysis
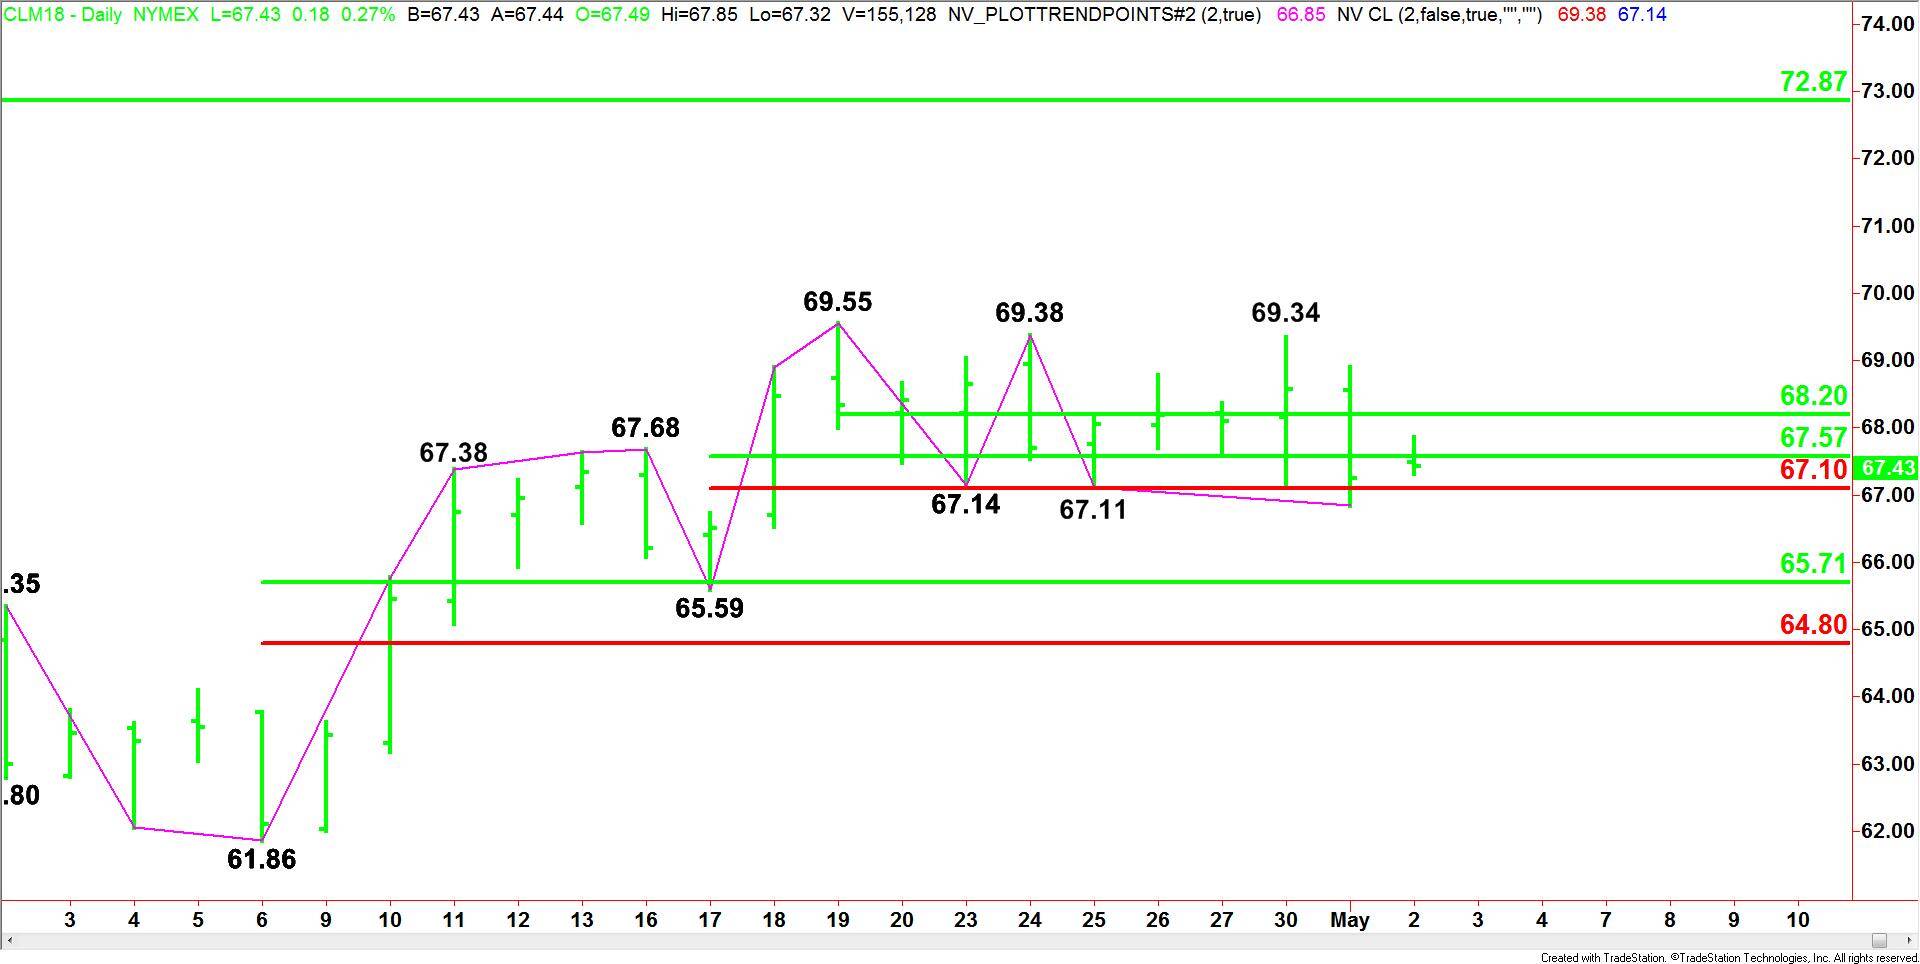
The main trend is down according to the daily swing chart. A trade through $66.85 will signal a resumption of the downtrend.
A trade through $69.55 will change the main trend to up.
Traders are also reacting to a series of retracement levels.
The main range is $61.86 to $69.55. Its retracement zone at $65.71 to $64.80 is the primary downside target.
The intermediate range is $65.59 to $69.55. Its retracement zone at $67.57 to $67.10 is currently being tested.
The short-term range is $69.55 to $66.85. Its 50% level or pivot is $68.20.
Daily Swing Chart Technical Forecast
Based on the early price action, the direction of the crude oil market the rest of the session will be determined by trader reaction to the intermediate Fib level at $67.10.
Holding above $67.10 will indicate the presence of buyers. This could trigger fast moves into 50% levels at $67.57 and $68.20. The latter is a possible trigger point for an acceleration into a series of highs at $69.34, $69.38 and 69.55.
A sustained move under $67.10 will signal the presence of sellers. Taking out $66.85 will indicate the selling is getting stronger with the next targets the main 50% level at $65.71 and another main bottom at $65.59.