
U.S. West Texas Intermediate crude oil futures are trading higher late Friday. The market is trading inside yesterday’s range which suggests investor indecision and impending volatility. Today’s U.S. Energy Information Administration’s inventories report for the week-ending December 21 showed a 46,000 barrel draw down. This was lighter than expectations. Nonetheless, prices firmed primarily because of stock market strength.
At 2029 GMT, February WTI crude oil is trading $45.30, up $0.69 or +1.52%.
The market needs to close over $45.59 to produce a potentially bullish weekly closing price reversal bottom. This is likely to happen if the stock market surges into its close.

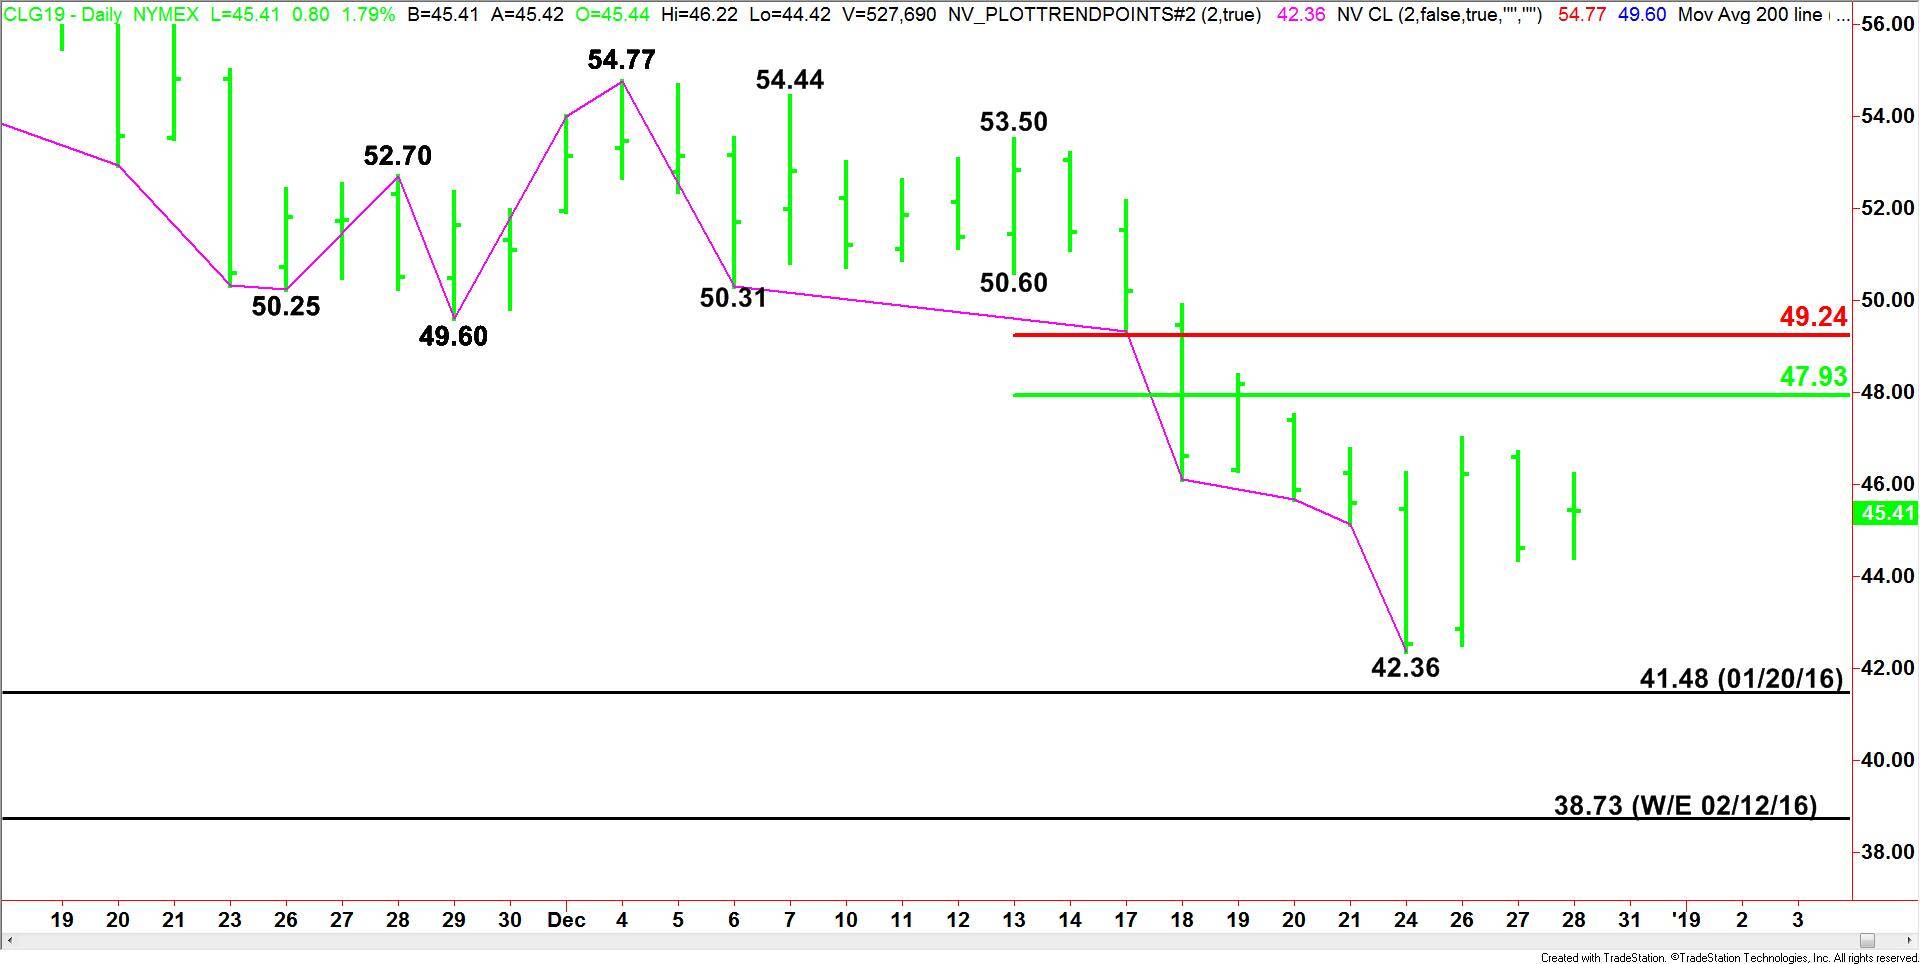
Daily Swing Chart Technical Analysis
The main trend is down according to the daily swing chart. The main trend will change to up on a trade through $54.77. A move through $42.36 will signal a resumption of the downtrend.
The minor range is $42.36 to $47.00. Its 50% level or pivot at $44.68 has provided support the last two days.
Another minor range is $53.50 to $42.36. Its retracement zone at $47.93 to $49.24 is the next resistance zone target.
Daily Swing Chart Technical Forecast Into Close
Based on the current price at $45.30, the direction of the February WTI crude oil market into the close is likely to be determined by trader reaction to the pivot at $44.68.
Bullish Scenario
A sustained move over $44.68 will help the market rally into the close. Finishing over $45.59 will put the market higher for the week. This could be significant for next week’s price action since it will be a potentially bullish sign.
Bearish Scenario
Crude oil is likely to finish lower for the session if $44.68 fails as support.