



U.S. West Texas Intermediate crude oil futures are trading lower shortly before the regular session opening. The market is trading inside Friday’s range which suggests investor indecision and impending volatility.
At 0821 GMT, September WTI crude oil is trading $69.36, down $0.59 or -0.84%.
The market is being supported by concerns over spare capacity after the International Energy Agency (IEA) warned that due to increased production from Saudi Arabia and Russia, there is very little room for a major supply disruption. However, pressuring prices is the added supply due to a resumption of Libyan export activities.
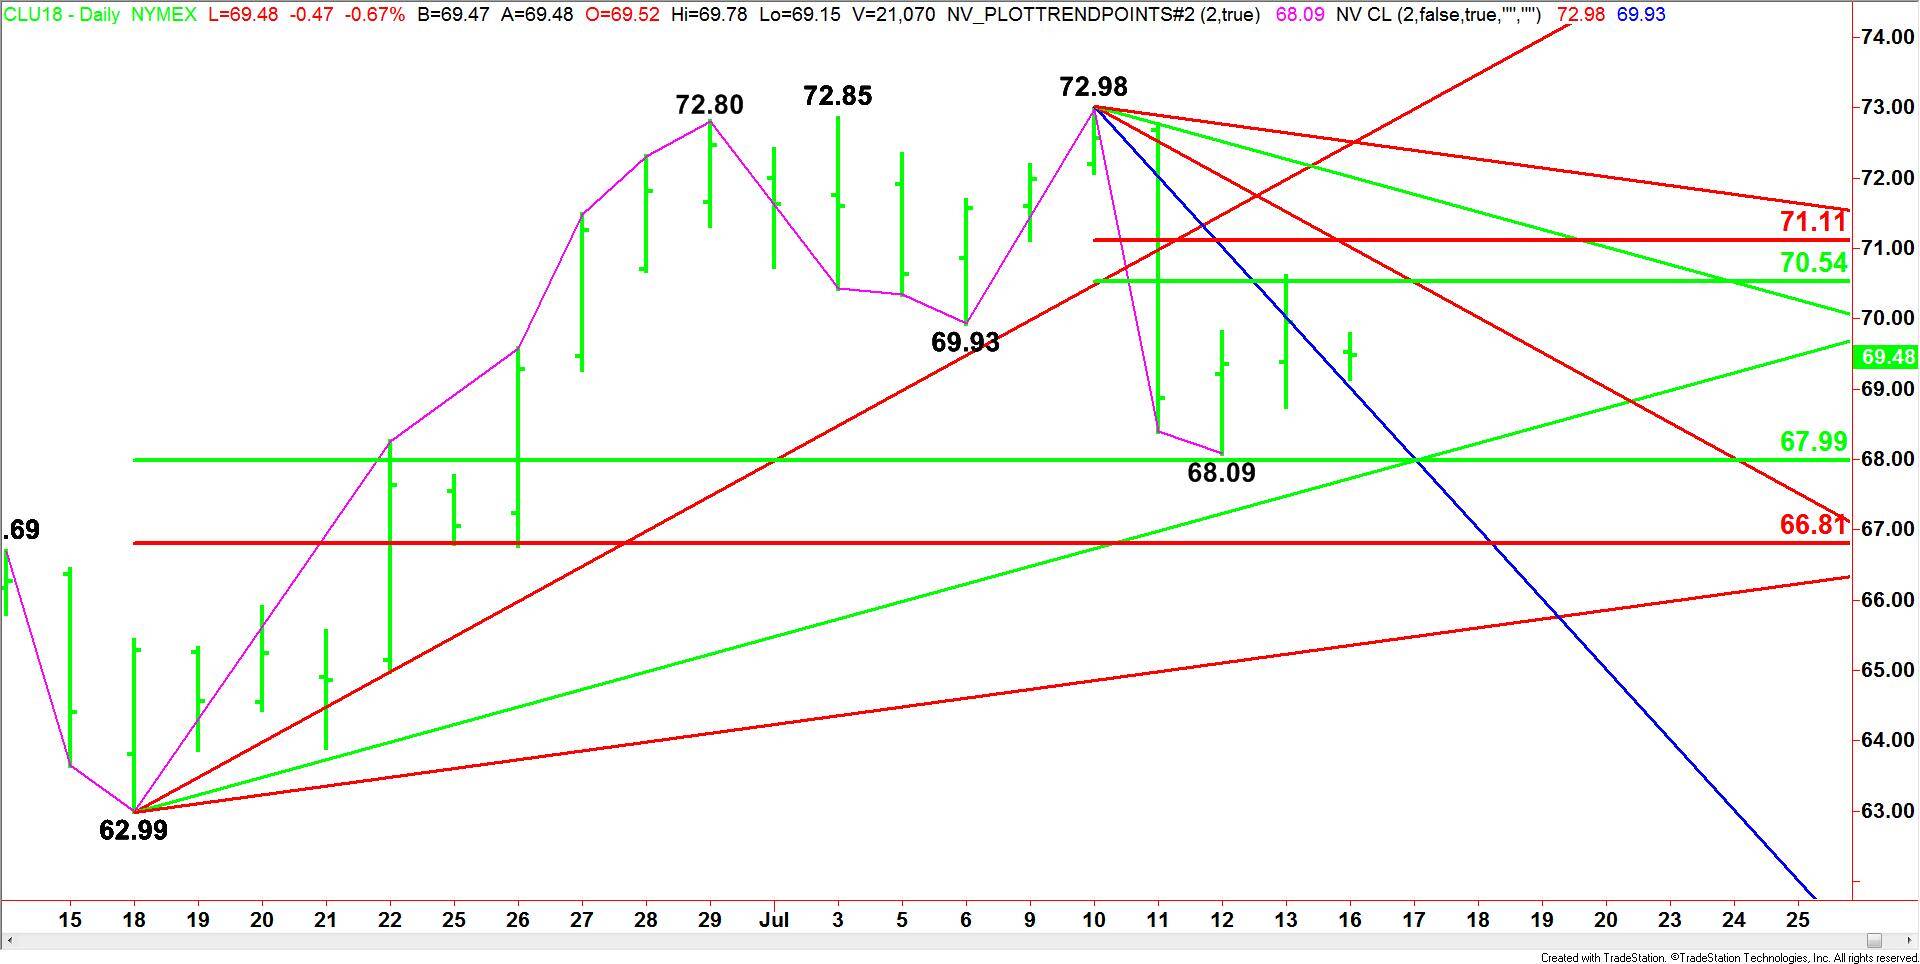
Daily Technical Analysis
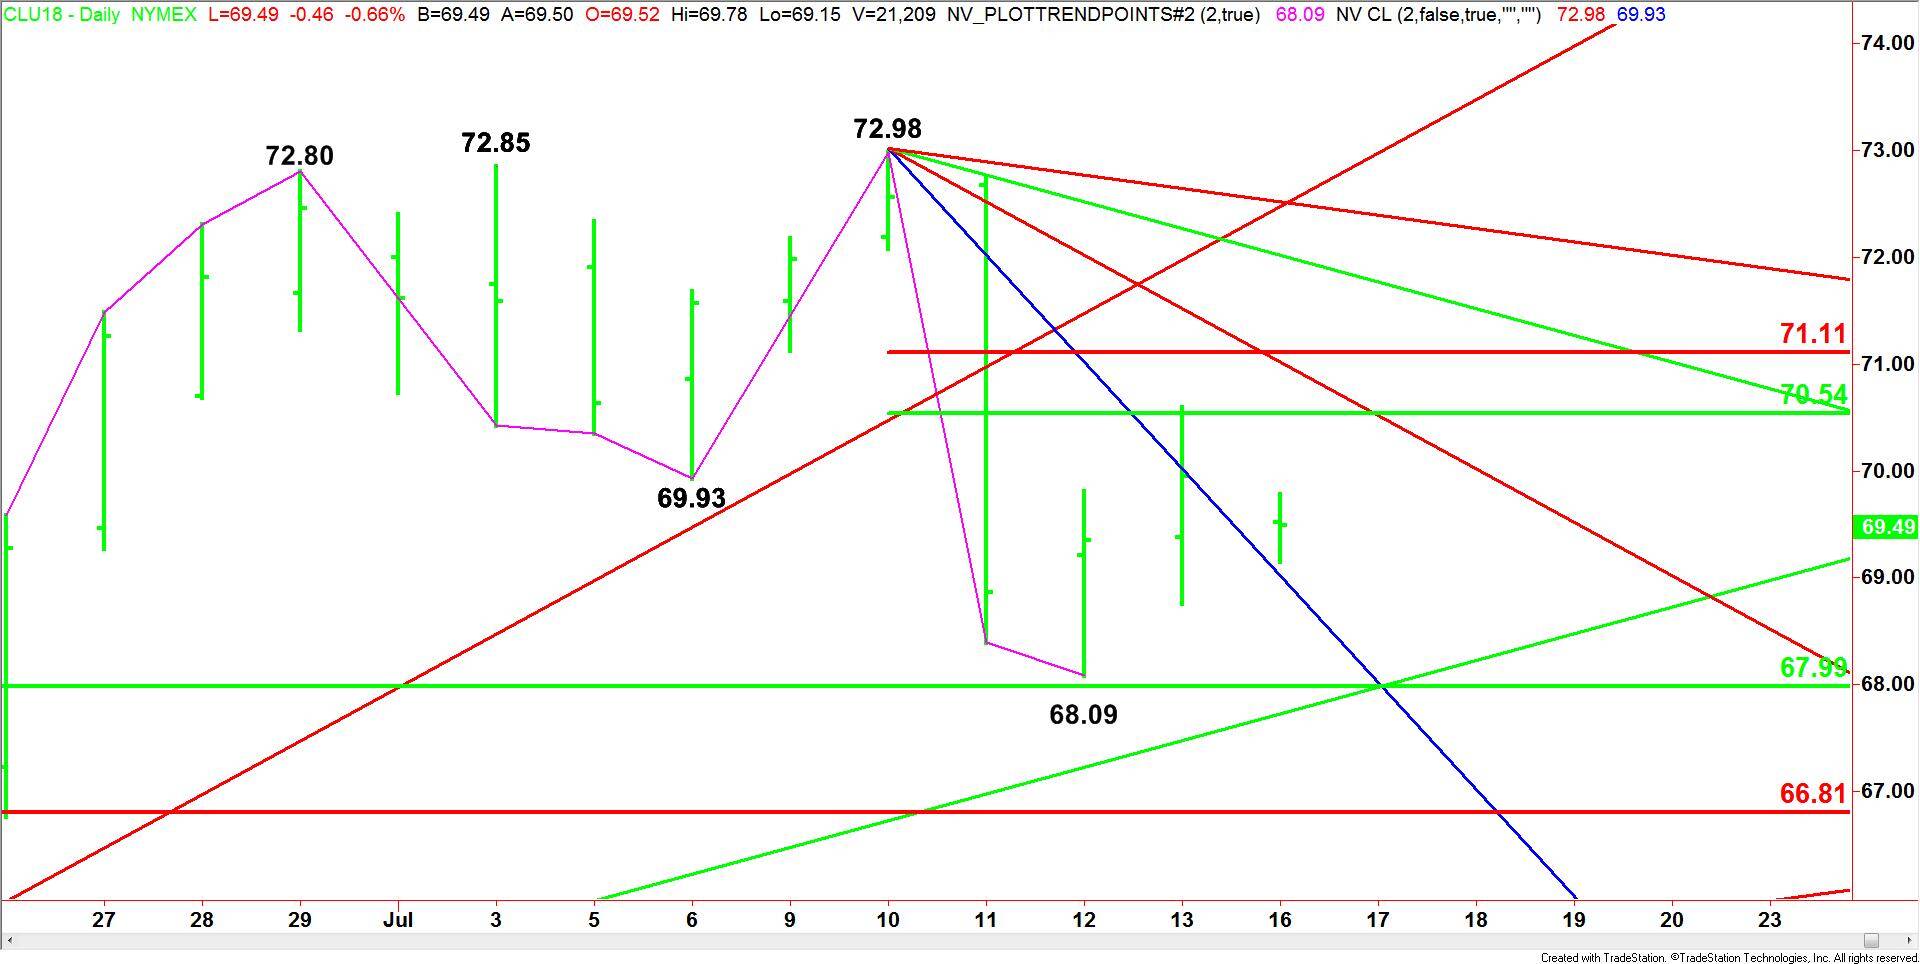
The main trend is down according to the daily swing chart. The trend turned down on July 11 when sellers took out the swing bottom at $69.93. The new main top is $72.98. A trade through this price will change the main trend to up.
The main range is $62.99 to $72.98. Its retracement zone at $67.99 to $66.81 is the primary downside target. Sellers came close to hitting this target on July 12 when the low hit $68.09. Inside this zone is an uptrending Gann angle at $67.74, making it a valid downside target.
The short-term range is $72.98 to $68.09. Its retracement zone at $70.54 to $71.11 is the primary upside target. Since the main trend is down, sellers may come in on a test of this zone. On July 13, this zone stopped the rally at $70.60. Inside this zone is a downtrending Gann angle at $70.98, making it a valid target.
Suggested Articles
- Gold Moves Up from 7-Month Low but Risk for Decline Continue to Exist
- Trump’s Trade War: The Good, the Bad and the Ugly
- Erdogan’s Biggest War is Inflation: The Turkish Lira in a Free Fall
Daily Technical Forecast
Based on the early price action, the direction of the September WTI crude oil market the rest of the session is likely to be determined by trader reaction to the steep downtrending Gann angle at $68.98.
A sustained move over $68.98 will indicate the presence of buyers. If this creates enough upside momentum then look for the rally to possibly extend into a series of potential resistance levels at $70.54, $70.98 and $71.11. Since the main trend is down, sellers may come in on a test of these levels.
A sustained move under $68.98 will signal the presence of sellers. This could trigger a fast break into $68.09, $67.99 and $67.74. The latter is the trigger point for an acceleration to the downside with $66.81 the next major target. This is an even stronger trigger point for an extension of the selling. Taking out this level targets the uptrending Gann angle at $65.37.