



March West Texas Intermediate crude oil futures finished higher on Wednesday, even though this week’s U.S. Energy Information Administration’s weekly inventories report showed inventories rose more than expected and U.S. oil production exceeded 10 million barrels a day in November for the first time in nearly 50 years.
Daily Technical Analysis
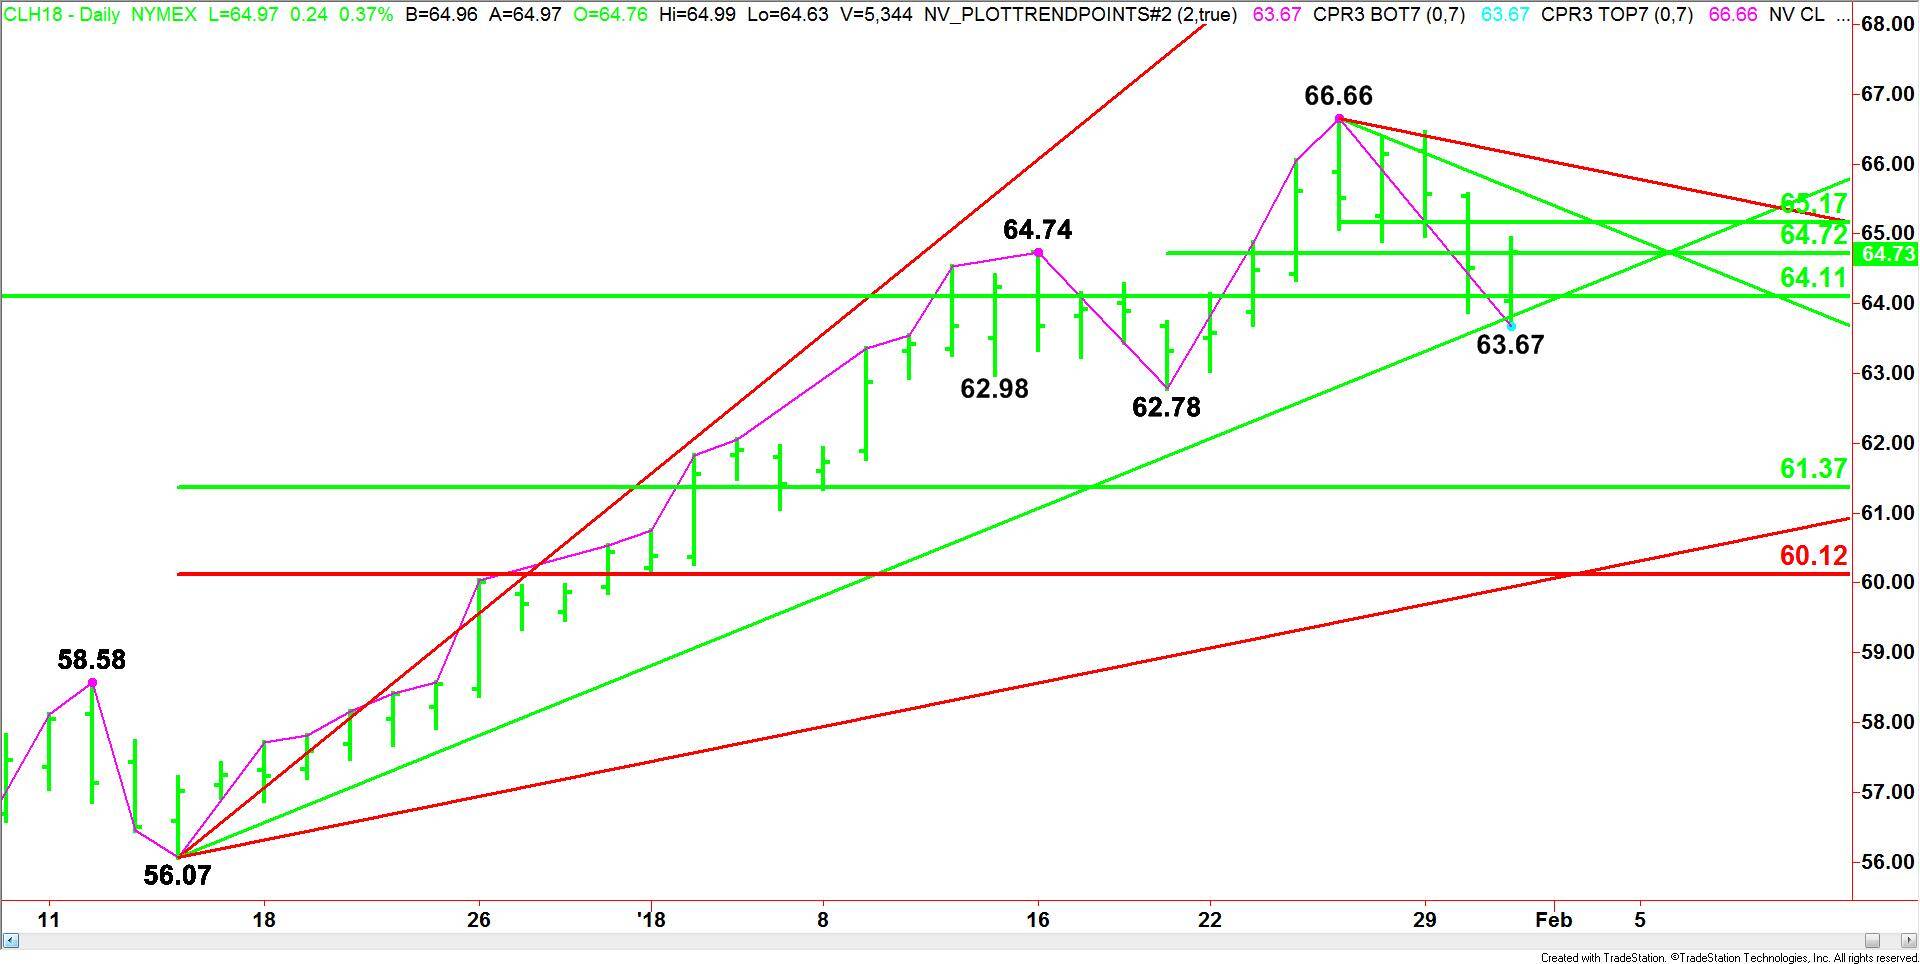
The main trend is up according to the daily swing chart, however, momentum has been trending lower since the formation of a closing price reversal top on January 25.
A trade through $66.66 will negate the chart pattern and signal a resumption of the uptrend.
A move through $63.67 will indicate the selling is getting stronger. This could drive the market into $62.78. A trade through this main bottom will change the main trend to down.
The market is currently straddling a series of 50% levels. The long-term 50% level is $64.11.
Short-term 50% levels come in at $64.72 and $65.17. Prices could move sideways unless there is a breakout over $65.17 or a breakdown under $64.11.
The main range is $56.07 to $66.66. If there is a change in trend then its retracement zone at $61.37 to $60.12 will become the primary downside target.
Daily Technical Forecast
Based on the close at $64.73, the direction of the crude oil market early in the session will be determined by trader reaction to a 50% level at $64.72.
A sustained move over $64.72 will indicate the presence of buyers. This could trigger a rally into the next 50% level at $65.17. This level is the trigger point for an acceleration into a pair of downtrending Gann angles at $65.41 and $66.04. The latter is the last potential resistance angle before the $66.66 main top.
A sustained move under $64.72 will signal the presence of sellers. This could lead to a break into $64.11 and an uptrending Gann angle at $64.07. This angle is very important to the structure of the chart pattern. It has been guiding the market higher for 32 sessions. If it is taken out with conviction then look for an acceleration to the downside with $62.78 the first target.
If $62.78 is taken out then the trend will change to down. This could create the downside momentum needed to test the main retracement zone at $61.37 to $60.12.