



Crude oil futures settled higher on the last day of the week as traders took profits after three days of steep sell-offs. The market was also supported by speculation that the OPEC-led production cuts would be extended beyond 2018, however, gains were limited by concerns over rising U.S. production. Baker Hughes also reported that the rig count increased.
May West Texas Intermediate crude oil settled at $64.94, up $0.56 or +0.87%.
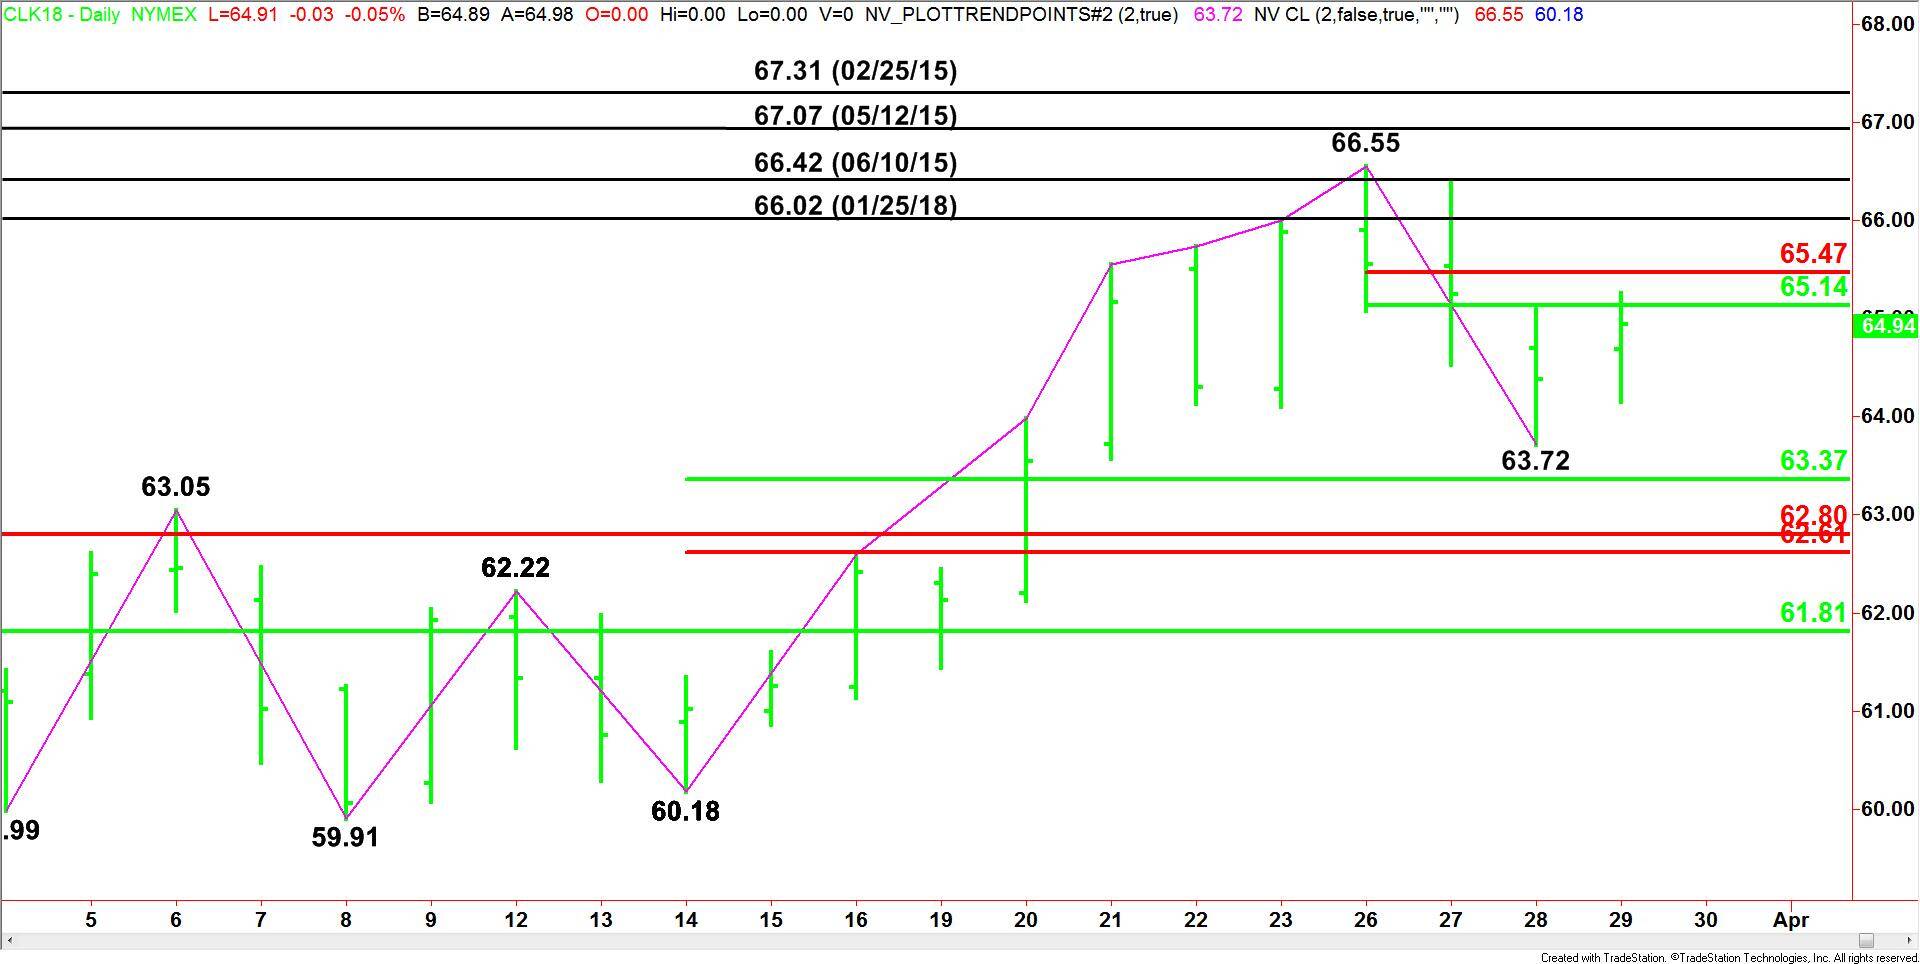
The week ended with the main trend up according to the swing chart, but momentum down due to the closing price reversal top on March 26. A trade through $66.55 will negate the reversal top and signal a resumption of the uptrend. A move through $63.72 will indicate the selling is getting stronger.
The short-term range is $66.55 to $63.72. Its retracement zone at $65.14 to $65.47 is acting like resistance. Aggressive counter-trend sellers may try to form a secondary lower top inside this zone. This would be the first sign that the trend is getting ready to turn lower.
The main range is $60.18 to $66.55. Its retracement zone at $63.37 to $62.61 is the first downside target. The long-term retracement zone is $62.80 to $61.81. The combination of the two zones creates a possible support cluster at $62.80 to $62.61. Since the main trend is up, we could see buyers come in on a test of this area.
Based on the close at $64.94, the direction of the crude oil market over the near-term is likely to be determined by trader reaction to the short-term 50% level at $65.14.
Overtaking $65.14 will signal the presence of buyers. This could lead to a quick test of the Fib level at $65.47. The rally will start to expand over this level.
The inability to overcome $65.14 will indicate the presence of sellers. This could lead to a retest of $63.72, followed by $63.37 then the support cluster at $62.80 to $62.61.