



June West Texas Intermediate crude oil futures are trading lower at the mid-session. The market is essentially rangebound with gains being capped by concerns over rising U.S. production and losses being limited by expectations of the reimposition of sanctions on Iran.
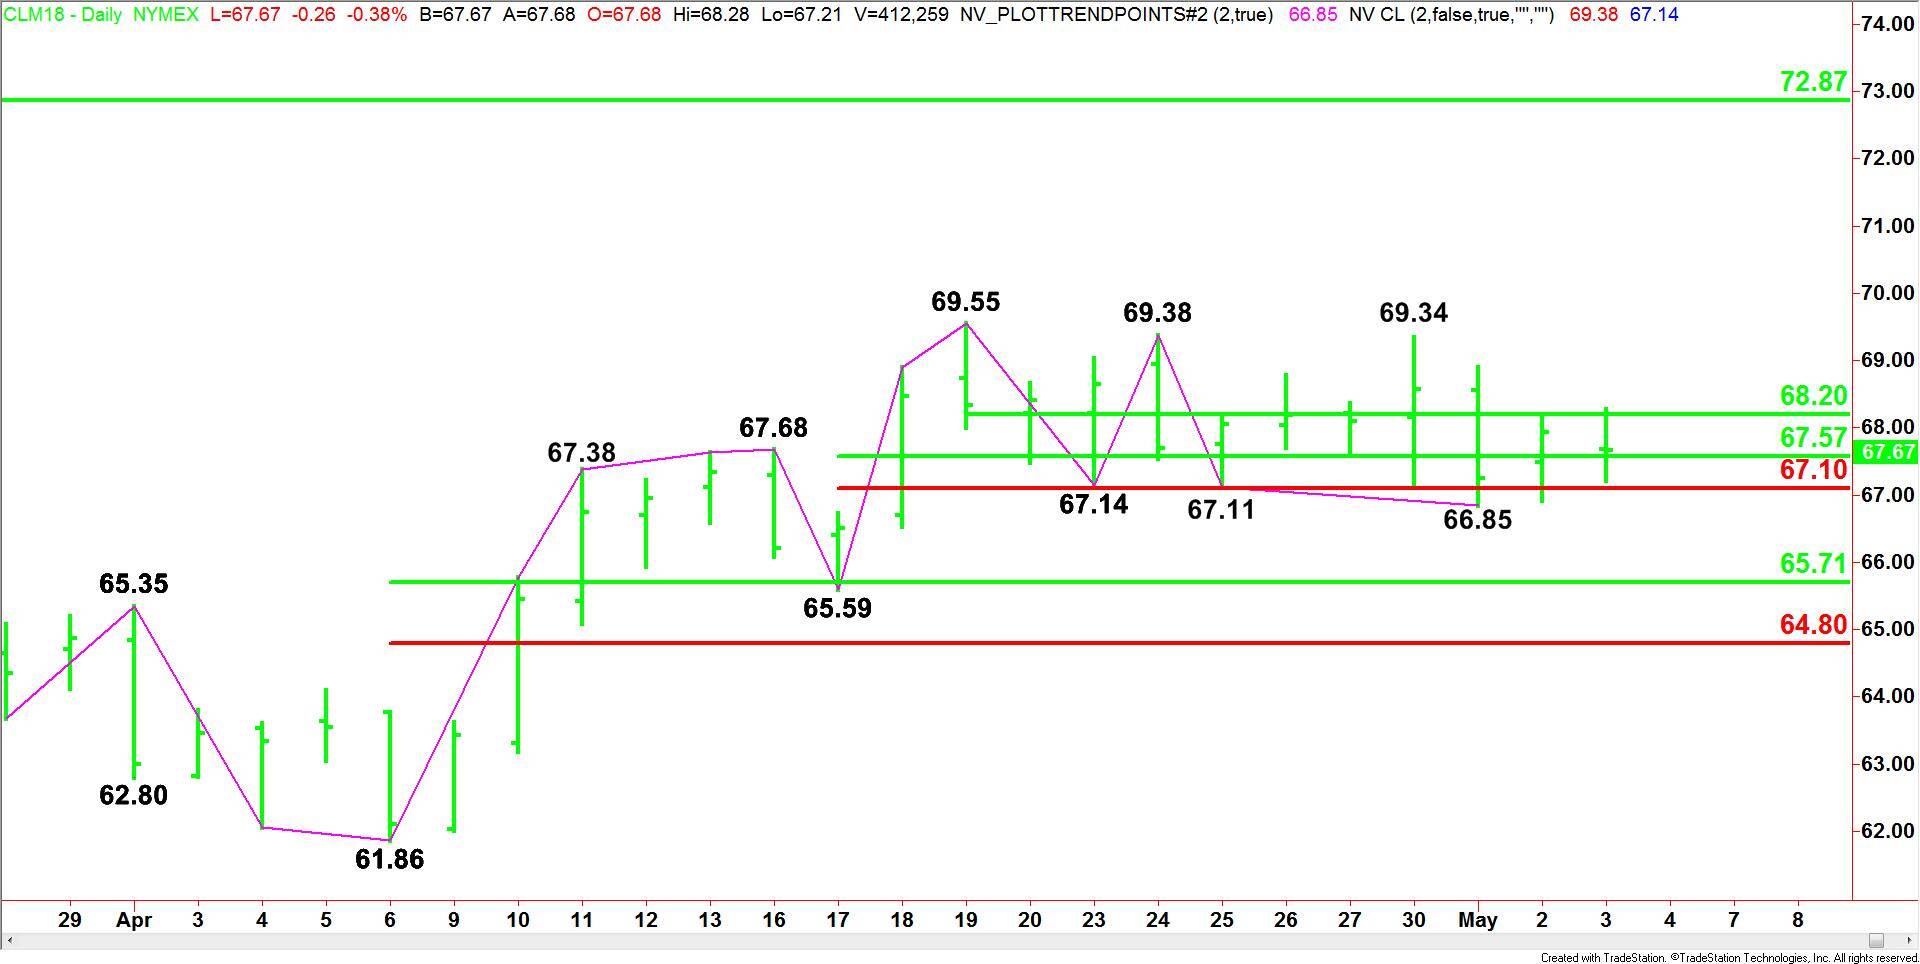
Daily Swing Chart Technical Analysis
The main trend is down according to the daily swing chart. The trend will change to up on a move through $69.38.
A trade through $66.85 will signal a resumption of the downtrend.
The price action is also being controlled by a series of retracement levels at $68.20, $67.57 and $67.10.
The main range is $61.86 to $69.55. If the sellers take control then look for a move into its retracement zone at $65.71 to $64.80 over the near-term. This zone is the primary downside target.
Daily Swing Chart Technical Forecast
Based on the current price action, the direction of the crude oil market the rest of the session is likely to be determined by trader reaction to the 50% level at $67.57.
A sustained move over $67.57 will indicate the presence of buyers. This could lead to a test of the 50% level at $68.20. This is a potential trigger point for an acceleration into a series of highs at $69.34, $69.38 and $69.55.
Taking out $69.55 will put the market in an extremely bullish position with a major, long-term 50% level at $72.87 the next major upside target.
A sustained move under $67.57 will signal the presence of sellers. This could trigger a quick break into the Fibonacci level at $67.10, followed by this week’s low at $66.85.
Taking out $66.85 could trigger a plunge into the main 50% level at $65.71, followed by the main bottom at $65.59.